The SARS-CoV-2 Evolution: Viral Extinction by Lack of Polymerase ActivityDiscussion of First 4557 Sequences and Clustered Evolutionary Exchanges
Klaus Fiedler
The structure of the S surface protein of the Wuhan isolate of the Severe Acute Respiratory Syndrome (SARS) coronavirus 2 (SARS-CoV-2) is containing amino acid loops, which are introduced in RaTG13 (bat), and harbour in analogous position the majority of glycan interacting residues of the HCov-OC43 spike. In SARS-CoV-2 these could structurally transpose interacting residues and alter or enlarge the binding site as comparatively viewed. The sub-strains of SARS-CoV-2 were analysed to determine changes in 429 sequences. Interestingly, the Asp614Gly S spike protein mutant, exported to many countries in the pandemic spread, harbours fewer further amino acid exchanges within the S protein. Predicted larger spectrum of mutants found with the Asp614 sub-strains is linked to the patient zero and the early phase. The S protein amino acid mutation rate since the outbreak of 6.0x10⁻⁵ may suggest that variations are more likely in the putative lectin-NTD which shows twice the lowest estimated frequency. A phylogenetic tree built from 3877 sequences suggests that the most recent common ancestor is dated to March 2018, or June 2019 when a z-score of 3 for outlier compensation is selected. The sporadic highly elevated mutation count in a strain from January 2020 (MT226610) is attributed to sub-strain formation with corresponding ancestral state that may have been founded in humans or the animal kingdom. RNA folding prediction confirms that structural changes may be found in the MT226610 sub-strain that has a Δ of free energy in the SARS-CoV-2 genome in positions 12000-13000. The affected area locates proximal to the ribosomal frame-shifting element and forms a distinct stem-loop encompassing or sharing the "SARS-CoV-2-conserved-structured region" (12610-12729). The extended trifoil structure may aid in viral RNA packaging or transcription. Protein results indicate, that the nsp8 (non-structural protein 8) primase-nsp9 cleavage by the viral protease, host receptor binding by the S protein NTD or processivity provided by nsp7-nsp8 associated with the polymerase protein may be affected by mutations in MT226610. Previous analyses by Subissi et la. [Proc. Natl. Acad. Sci. 111, E3900–E3909 (2014)] on SARS-CoV-1 nsp8 and the similarity of the polymerase complex to SARS-CoV-2 (RMSD 0.67 Å aligned domain) already suggest, that the RNA primer extension activity of SARS-CoV-2 nsp8 could be strongly reduced in the mutant background. Hypotheses discussed in this work concerning sub-strain formation of MT226610 or hyper-mutator phenotype of MT226610/MT326179 are non-exclusive. [HTML First Online 8 May 2020]
The structures of the SARS-CoV-2 spike glycoprotein have recently been solved and did not visualize loop residues, possibly involved in the ligand interaction in the NTDs (the 6vsb or 6vyb up/open and 6vxx down/closed structures) (1 , 2). The SARS-CoV-1 and SARS-CoV-2 closely resemble SARS-like coronaviridae from a natural reservoir and in the recent outbreak, the RaTG13 strain was found to be most similar (3, 4) (a Sarbecovirus). It may show identical fuzzy or distinct binding to glycans than the SARS-CoV-2. For a bovine CoV the structure analysis and comparison showed that this domain was similar to galectin-3 (5). Here, this can be confirmed by searching PDBeFold (6) with the spike of the SARS-CoV-2 (6vsb modelled with loops) for galectin-1, -2, -3, -4, -7 to -10 and -13 (Q-score ∼0.2 and RMSD of ≥2.1 Å) and in searching with the lectin-domain of HCoV-OC43 (an Embecovirus; 6nzk) for galectin-1, -3, and -9 (Q-score ∼0.2 and RMSD of ≥2.7 Å).
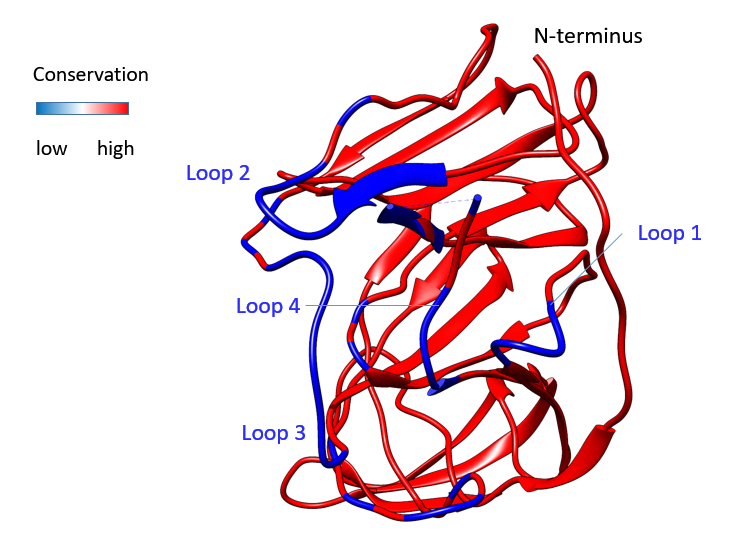
Figure 1A: The SARS-CoV-1 S protein N-terminal domain The 6acc structure of coronavirus SARS-CoV is shown with amino acids labelled in blue when not aligned or different from SARS-CoV-2 NTD.
The 6acc structure of coronavirus SARS-CoV is shown with amino acids labelled in blue when not aligned or different from SARS-CoV-2 NTD.
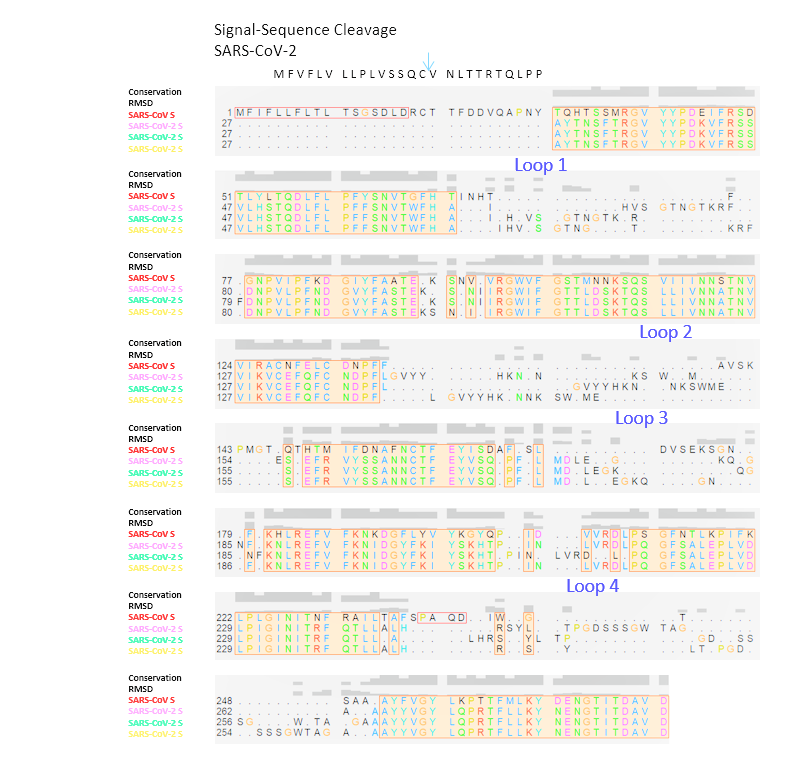
Figure 1B: Alignments of SARS-CoV-1/-2 S protein NTDsThe structural alignment of SARS-CoV NTD to the trimeric 6vsb models of SARS-CoV-2 is shown. The signal sequence is indicated, residues missing at the N-terminus are added. Loops that did not align are numbered. The Conservation score within this alignment is indicated, the RMSD (Root-Mean Square Deviation) of the backbone is graphed. Sequences are numbered from the N-terminus towards the pivot area of the S glycoprotein.
The structural alignment of SARS-CoV NTD to the trimeric 6vsb models of SARS-CoV-2 is shown. The signal sequence is indicated, residues missing at the N-terminus are added. Loops that did not align are numbered. The Conservation score within this alignment is indicated, the RMSD (Root-Mean Square Deviation) of the backbone is graphed. Sequences are numbered from the N-terminus towards the pivot area of the S glycoprotein.
The spike S glycoprotein displays differential sialic acid affinities in different viral strains (7, 8). Infectious uptake has been shown to involve lectin activity combined with an esterase function for some but not all coronaviridae. The necessity of the esterase subsequent to lectin-carbohydrate interactions, has been discounted by some. The new SARS-CoV-2 virus has two additional open reading frames (ORF8 and 10) that have reappeared in virus evolution of this case: One of these is short (38 amino acids, ORF10) unlikely to form a large binding site, the other is longer (121 amino acids, ORF8) with a predicted classical signal-sequence and an extracellular domain) (4, 9) and could represent a candidate protein for an esterase. In HCov-OC43 infected tissue, cell attachment by lectin activity is followed by esterase cleavage of the O-acetylated group of the sialic acid. After the initial capturing of the virus, unknown in molecular events for SARS-CoV-2 (a Sarbecovirus), SARS-CoV-2 then binds to the ACE2 (angiotensin-converting enzyme 2) receptor (10, 11) to gain close apposition to the plasma membrane. S protein is cleaved by proteases (furin and TMPRSS2) which allows to remove the shielding S1 (N-terminal S) once the Receptor-Binding Domain (RBD) has contacted ACE2, as modelled (12), and then exposes the S2 fusion peptide (C-terminal S) and highly flexible coiled-coil fusion machinery (see also SARS-CoV). Whether the S lectin NTD responds to binding and shear in a catch-bond manner (13) is currently not known and I suggest that catch-bond coupled conformational changes may expose the RBD.
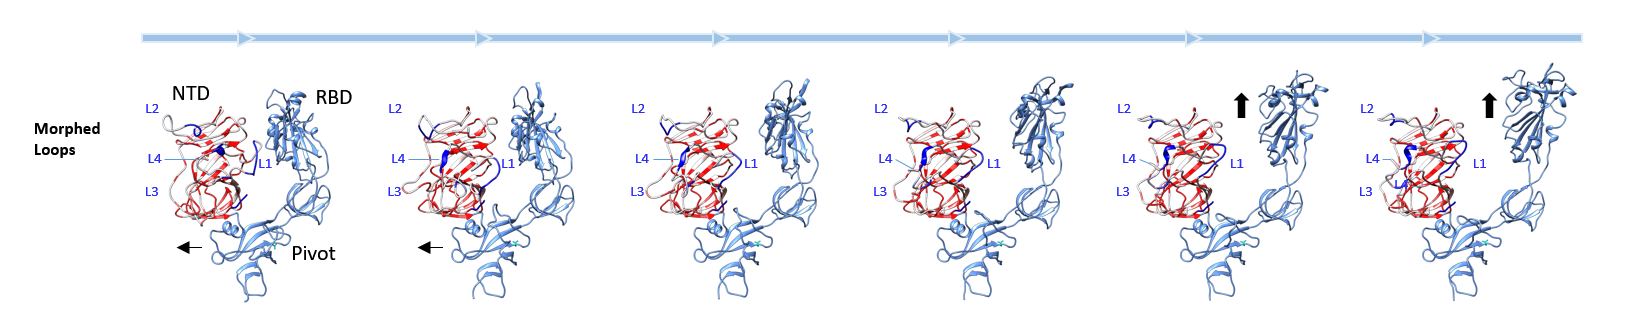
Figure 1C: SARS-CoV-2 S protein morphing SARS-CoV-2 NTDs modelled with the Swiss-Model server based on 6vsb from SARS-CoV-2 with loops introduced in analogy to other structures used as template. The Swiss-Model server was used with default settings. Loops are labelled in analogous position to SARS-CoV NTD and the backbone is covered with the conservation scores of S protein NTDs (previous panels).
SARS-CoV-2 NTDs modelled with the Swiss-Model server based on 6vsb from SARS-CoV-2 with loops introduced in analogy to other structures used as template. The Swiss-Model server was used with default settings. Loops are labelled in analogous position to SARS-CoV NTD and the backbone is covered with the conservation scores of S protein NTDs (previous panels).
Macromolecular evolution could implicate bursts of alterations of protein interfaces and clustered changes.
Bursts of evolution or rapid changes are exceeding the average mutation rate of organismal changes and are proposed to lead to rapid adaptation. Apart from molecularly explained mutator
strains these "evolutionary jumps" are found as stochastic events in evolution.
Based on theoretical
calculations by Kauffman and co-workers (see "The Origins of Order", Stuart Kauffman, 1993, Oxford University Press)
it has been suggested that these or similar events can be quantified and visualized in protein
adaptation. Although not directly discussed, the evolution of viruses and interface residues could thus follow a similar scheme wherein interacting residues are hypothesized
to cause adaptive walks
to higher fitness or increased enzymatic activities if altered in point mutations. In the original NK model, the immune response and affinity maturation was analysed
and could accommodate previous experimental observations on E. coli lac repressor, for example. 40 neighbouring residues that are affected by mutational
change were found to optimally reflect the evolutionary model and could be extrapolated to apply to enzymatic function.
The ensuing walk to regain of fitness, if affected by mutational alteration, could implicate changes that most often would end in loss and is proposed to exceed previous
fitness level in only approximately 1 % of amino-acid alterations. The interrupted
walk would then be
what can be observed in the current SARS-CoV-2 pandemic and select mutants.
In the evolution of β-coronaviridae, the primate (humans) and/or bat order of placentalia have become amenable to the infection. Subtle viral changes noticed by several laboratories worldwide led to early transmissions with a high R0, that was followed by purifying and terminal selection that ended the epidemic outbreaks (14, 15, 16). In the 2019 outbreak, the receptor-binding by the RBD is shown to be altered in species specificity and suggests that protein-protein interactions have been adapted to the new host. The swabs collected in the SARS-CoV-2 infection showed a high replication in the nasal and pharyngeal mucous membranes (17). To study the ways of infectious transmission, a detailed analysis of the S protein NTD was carried through since it may have an additional role that is not yet described.
Results
Structural Analyses of the Coronavirus N-terminal Domains
The 6acc structure of SARS-CoV S protein was aligned with the SARS-CoV-2 S protein and considerable structural difference was found when aligned amino acids were measured. The RMSD was ∼1.23 Å comparing the NTDs of 6acc to 6vsb, the SARS-CoV-2 structure (2, 18). To elucidate further structural similarities, a Swiss-Model queue was used to establish the approximate looping of the 6vsb, a structural analysis that is based on template alignments (19, 20) (Fig. 1). 6vsb is trimeric and shows in itself RMSDs of 0.7-0.8 Å among the NTDs, which is a high deviation from the ideal trimer. The three models corresponding to the A/B/C structures of 6vsb are plotted in Fig. 1C in a structurally morphed sequence: Linear settings were chosen to show interdomain backbone movements that cause RBD exposure. Akin to a bolt being pulled the NTD seems to push and pull the pivot that releases the RBD to spring up. In the up/open conformation the receptor ACE2 is then bound. Interestingly, the loop 1 structure of 6vsb_A shows two strands that are positioned to stabilize loop residues that are exposed. These are not found similarly in the models of structures B and C. Structure A is the one protomer that has grossly changed in conformation and exposes the RBD.
To further understand the structural similarities and differences, alignments of structures were compared in Fig. 1B. The loop residues missing or shortened in the NTD of SARS-CoV (Fig. 1A) are labelled (loop 1, 2, 3, 4). To compare the SARS-CoV-2 of the current outbreak to S proteins found in coronaviridae from animals further sequences were analysed.
Phylogenetic Analysis of SARS-Coronaviridae
A phylogenetic tree built from the NTD is shown in which was constructed from a TBLASTN output (the search retrieved 429 genomic sequences with a cut-off of 33.3 identity and max. score of 584) (21). The present sequence analysis would assert, similar to in the previous (4, 9), that in a lineage from SARS-like bat (CoVZXC21) and SARS-like pangolin (MP789) to genomic SARS2-like bat (RaTG13) the SARS-CoV-2 (Wuhan-Hu-1 or BetaCov/Wuhan/WIV) has transmuted (possibly including its glycoforms). To visualize the 429 S protein sequences use the sequence download and access the multiple sequence alignment page. The result suggests that the NTD lineage analysis alone without the genome analysis in full leads to a concordant result. The similarities of coronaviridae N-terminal domains, not encompassing MERS-CoV below the TBLASTN search cut-off, is surprisingly high, several continents and animal species carry similar SARS-CoV viridae that moved or were carried, e.g. from Asia to Africa.
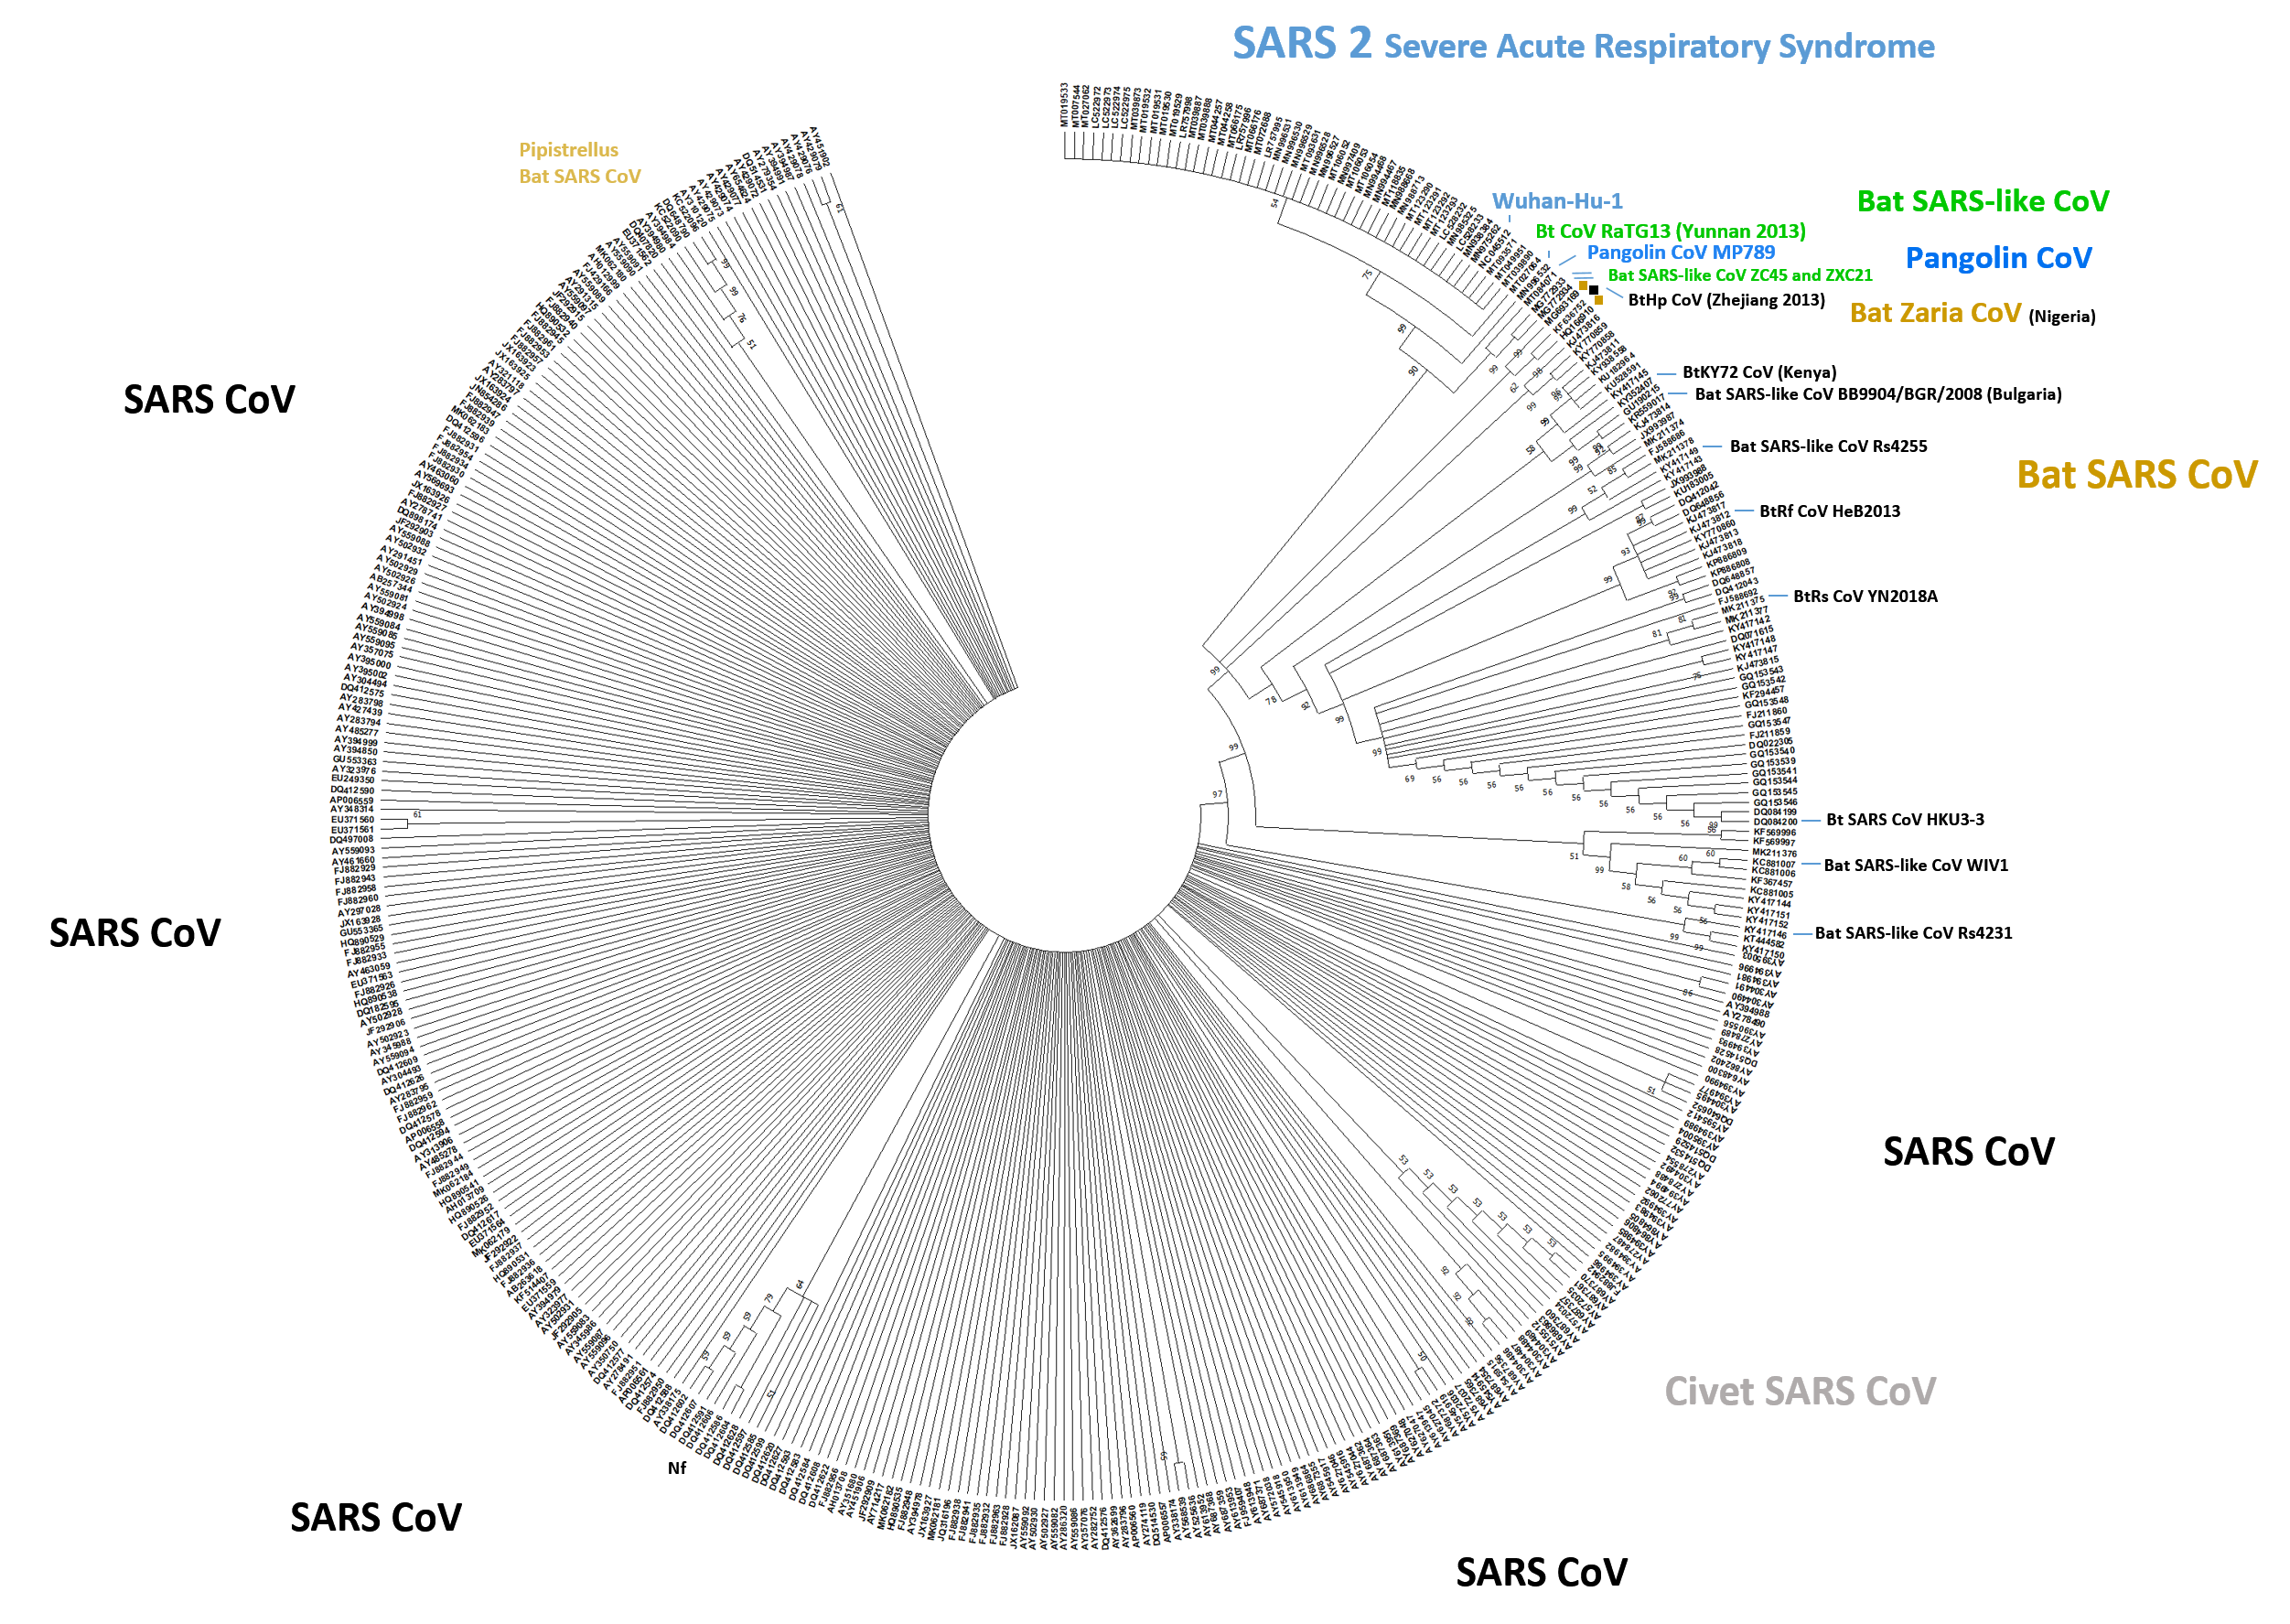
Supplementary Fig. 1: Phylogenetic Tree of TBLASTN Alignments. The ranked results were re-aligned with CLUSTAL X (cut-off 33.3 identity) using default parameters and aligning the N-terminal domains only (NTD). The tree was generated with MEGA X 10 (28) using the Neighbour-Joining method. Bootstrapping indicates the likelihood of branch formation (50%-100%); the tree was condensed. The SARS-CoV-2 shows branching into two groups due to a His-Tyr amino acid replacement (search 22 March 2020). Few more isolates had single amino acid changes. SARS-CoV-2 sub-strain nCoV-Fin (MT020781) was omitted from the alignment since partially sequenced. The same tree generated in CLUSTAL X resulted in a slightly different branch pattern. Species or orders are indicated (and city of find for the Zaria coronavirus similar to the GhanaBt-CoV, or country of find), naming of “SARS” or “SARS 2” is used as entered or implied by sequence similarity and submission details. Most isolated sub-strains were from Asia (China etc.), some from Africa or Europe. As expected, human SARS-CoV can be grouped with civet CoV which is seen here in a select sub-group for the NTD phylogenetic tree. Nf: Non-functional spike (tissue-culture variant).
Putative Carbohydrates Bound to the S-Protein
To further understand the structural alignments and exposed loop residues, SARS-CoV-2 S protein was contrasted with other human coronaviruses. The 6vsb model was compared with the HCov-OC43 (22) structure (6nzk) and gave a Q-score ∼0.4 and RMSD of 2.2 Å (23). By structural match, the bound carbohydrate 9-O-acetyl sialic acid (methylated) of HCov-OC43 was introduced to the SARS-CoV-2 S NTD (Fig. 2). These TBLASTN results were compared to the recent Wuhan outbreak SARS-CoV-2 (MN908947) spike glycoprotein (9). MERS (Middle East Respiratory Syndrome)-CoVs (a Merbecovirus) did not align at the 5'-end of the encoding RNA and were not added; the structural alignment suggested a similarity of MERS-CoV NTDs to the SARS-CoV-2 NTD that was in the same range than the structural similarity of SARS-CoV-2 to galectins themselves (Q-score < 0.3). Multiple sequence alignment of the translated protein domain of the CoVs S glycoprotein yielded some fit with the newly described structure when included: The 6nzk structure, relating to HCov-OC43, and 6vsb structure of SARS-CoV-2 (2) were added and structural overlays (Fig. 2) showed that loops in low conserved areas fitted the alignment. The pivot area that can be visualized in the previous structural analysis is located in-between the NTD and RBD (Fig. 3, ) and is topped by the fold of the NTD (1): This domain has at least three β-sheets, one plus two pleated. Apposed and connected is a highly variable and likely mobile molecular surface including loops, which could not be resolved (orange marks MN908947) and is lever-connected. The hyper-variable residues (loop of insertion 1) are structurally appended and C-terminal to Leu56. Leu56 is located in the amino acid residues that are apposed and next to the resolved β-pleated sheets and positioned towards the RBD and fusion machinery. Not all amino acid residues could be aligned in a structurally meaningful pattern of overlay, several loops in β-pleated areas were shifted. By contrast, the area proximal to the lever with β-strands was largely concordant, just as the loop 1 and 4 residues (Fig. 2). All loop areas of low conservation are coloured by the ribbon amino acids in blue (Fig. 2) and compared to the HCoV-OC43. These fall into the place next to or around the grafted glycan of 6nzk structure and 6vsb model. On closer inspection it indicates that the hyper-variable area His69-Gly75 in Fig. 2 is overlaid by the carbohydrate, and thus is proposed here to be involved in adaptation to glycan interaction.
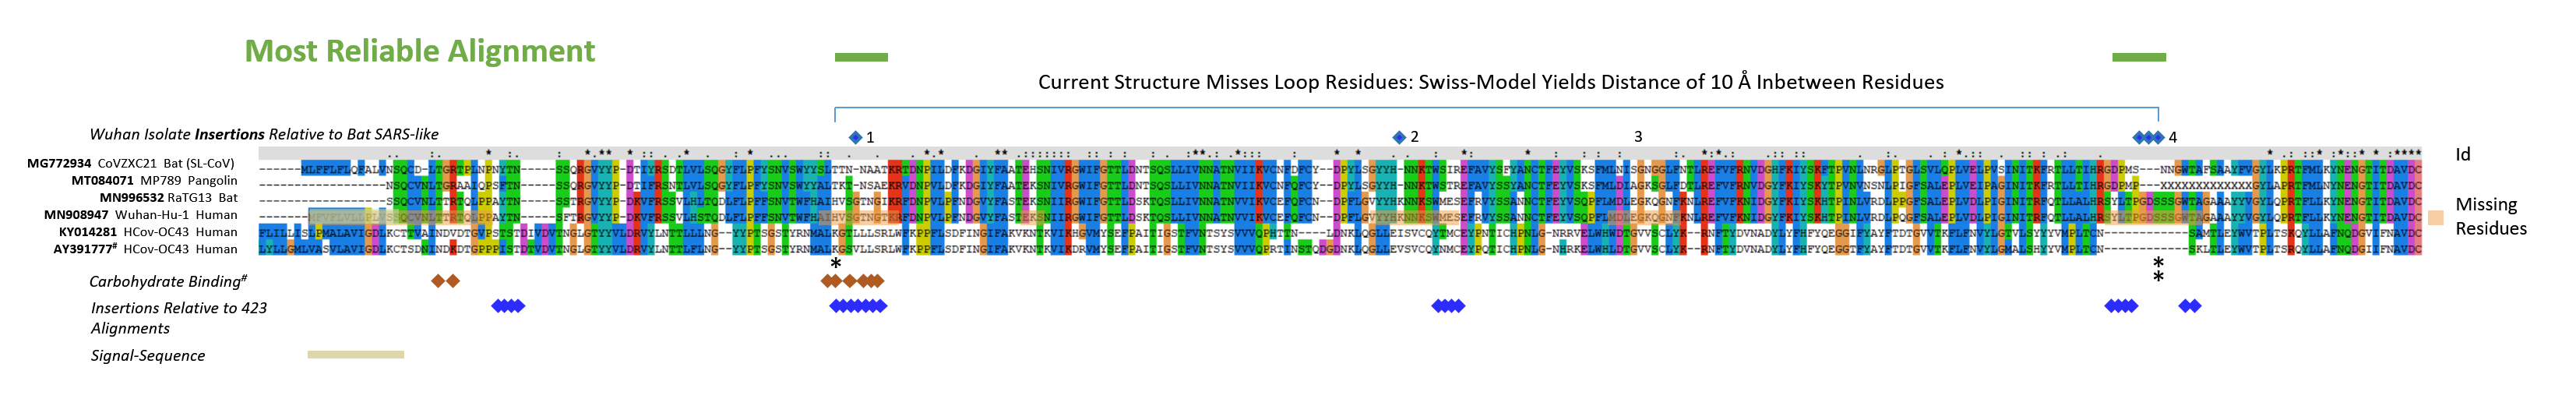
Supplementary Fig. 2: Sequences of the S glycoproteins were aligned using default parameters with CLUSTAL X (amino acids 1 - 291 of S glycoprotein of SARS-CoV-2). The sequences of MG772934, MT084071, MN996532, MN908947, Z32769/KY014281, AY391777/Q696P8 were marked with outlined squares (blue) for residues newly found in the Wuhan-Hu-1 and RaTG13 insertions seen in Fig. 2. Glycan interacting residues of the 6nzk structure (OC43 virus S protein) are labelled with a red square. Regions of highest variability in Fig. 2 are denoted with squares in blue below the alignment and are found in five continuous regions; since two residues within the Wuhan-Hu-1 and RaTG13 insert 4 (previously called 3) strongly align the usually missing 6 amino acids in other strains distribute from residues 247-259. Identities of residues (Id) are marked with an *, or : for conservative replacements or . for weakly conserved residues. Missing residues that could not be resolved in the recent structural analysis of the Wuhan-Hu-1 S NTDs are labelled with orange boxes. The signal sequence (estimation by SignalP 4/5 (37)) is indicated. Apparently, the signal sequence could not fully be predicted with the SignalP 5 algorithmic version, structural evidence now indicates that the sequence is 13 amino acids long and was predicted correctly by the SignalP 4.1. The Supplementary Figure was adjusted accordingly when the structural evidence (7c2l) confirmed the 4.1 version.
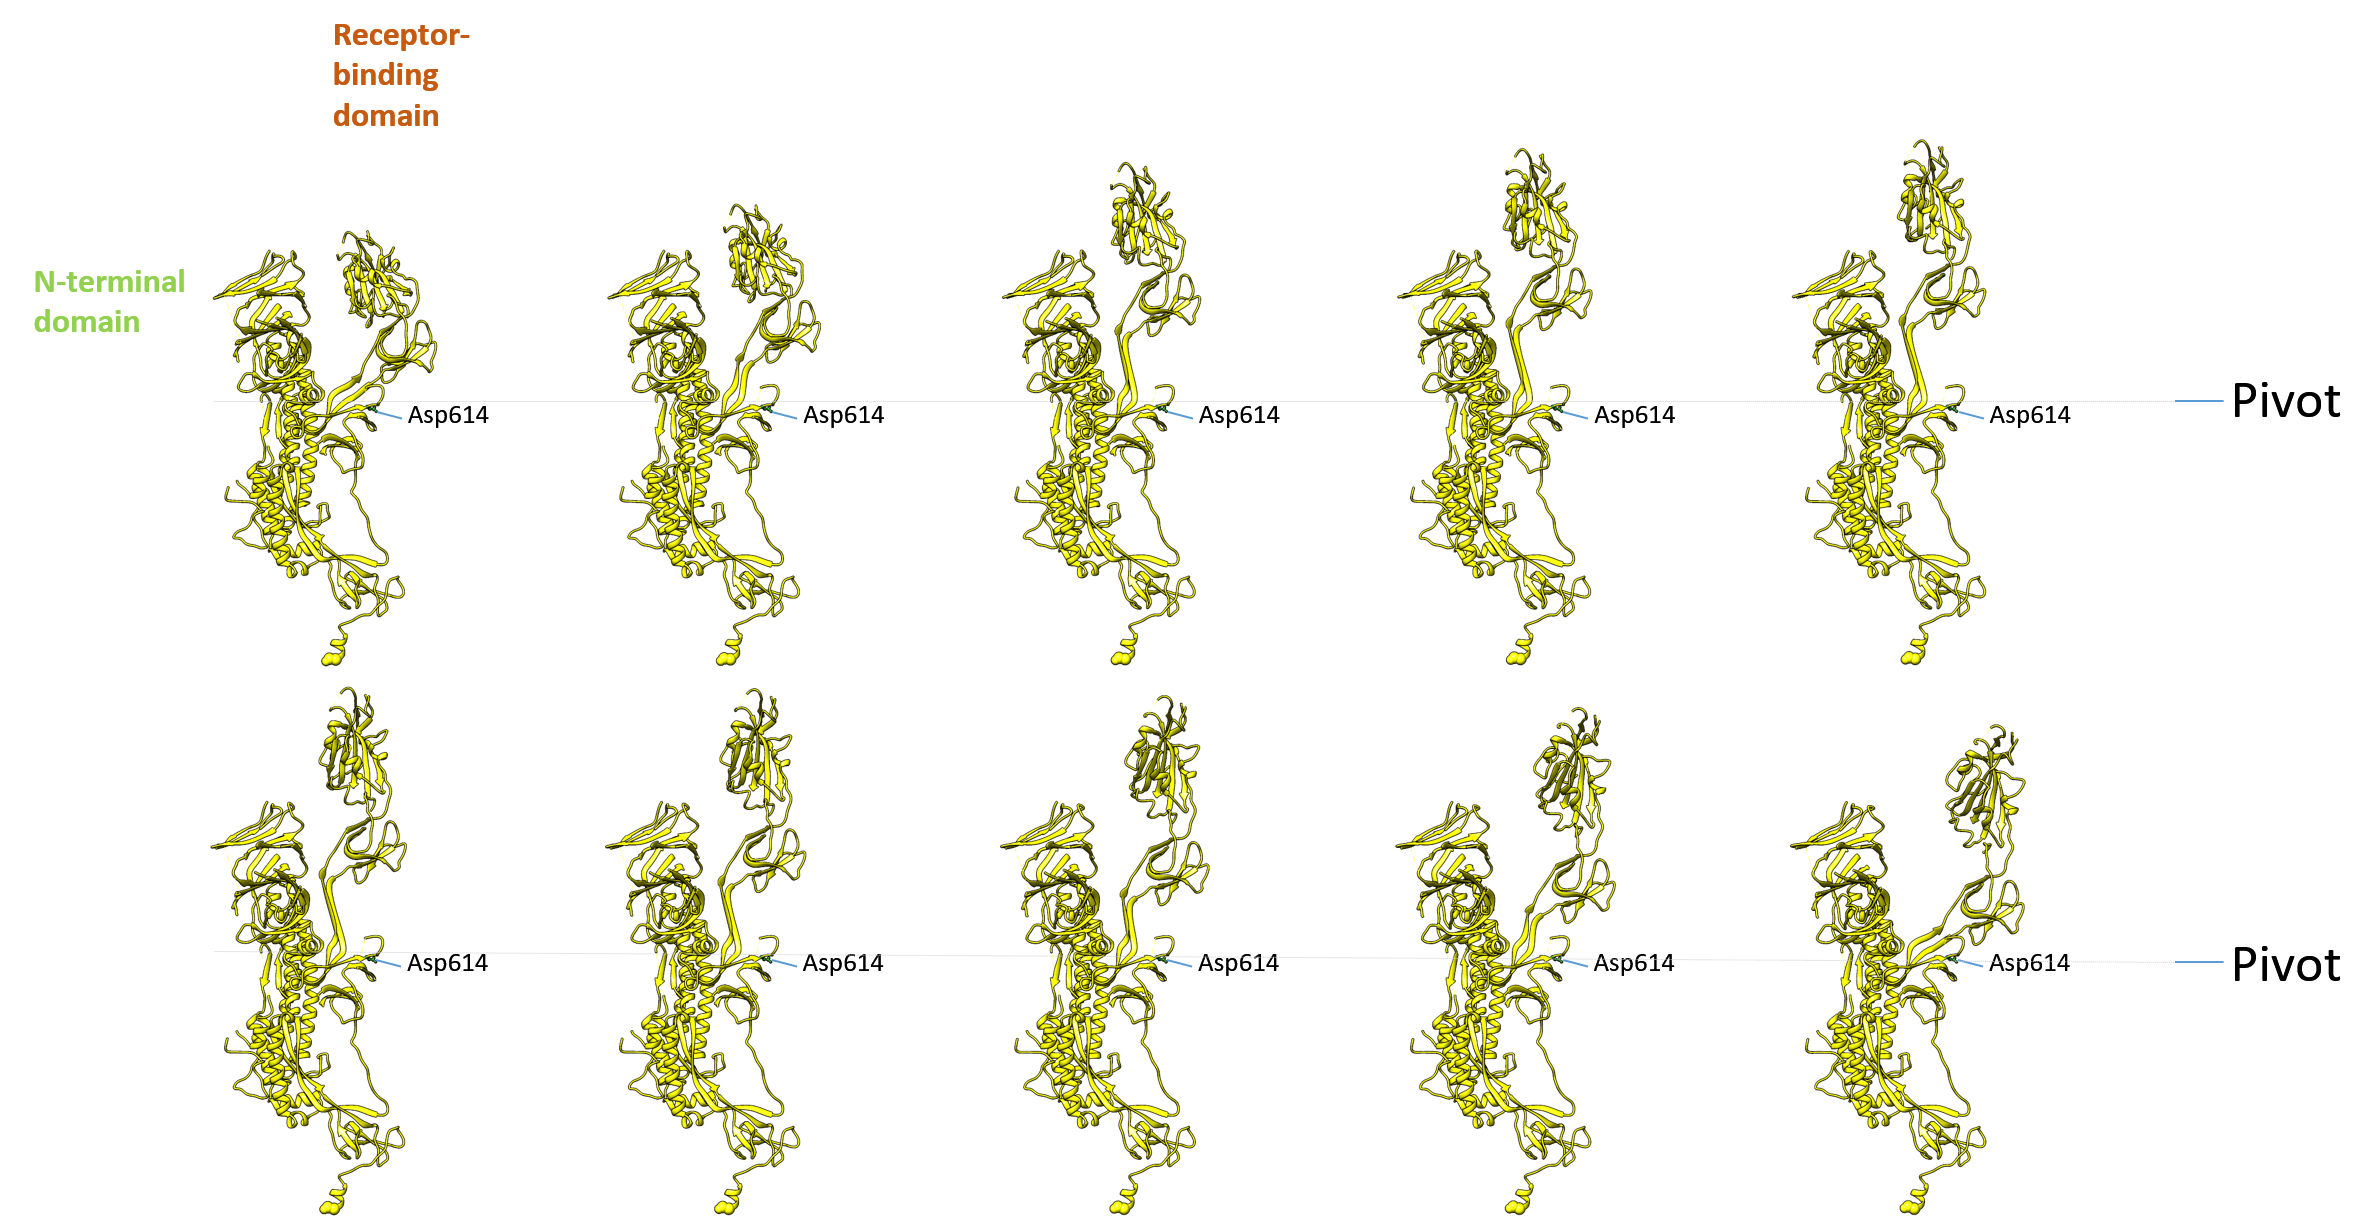
Supplementary Fig. 3: S protein movie. The presentation of 6vyb and 6vxx in panel format shows the change of the receptor-binding domain that is exposed towards the top in a pivot-like movement. Every 10th conformer of a morphed structurally aligned sequence of 100 structural transitions is shown, with a rotation about each group’s centre of mass and translation interpolation method with linear interpolation rate.
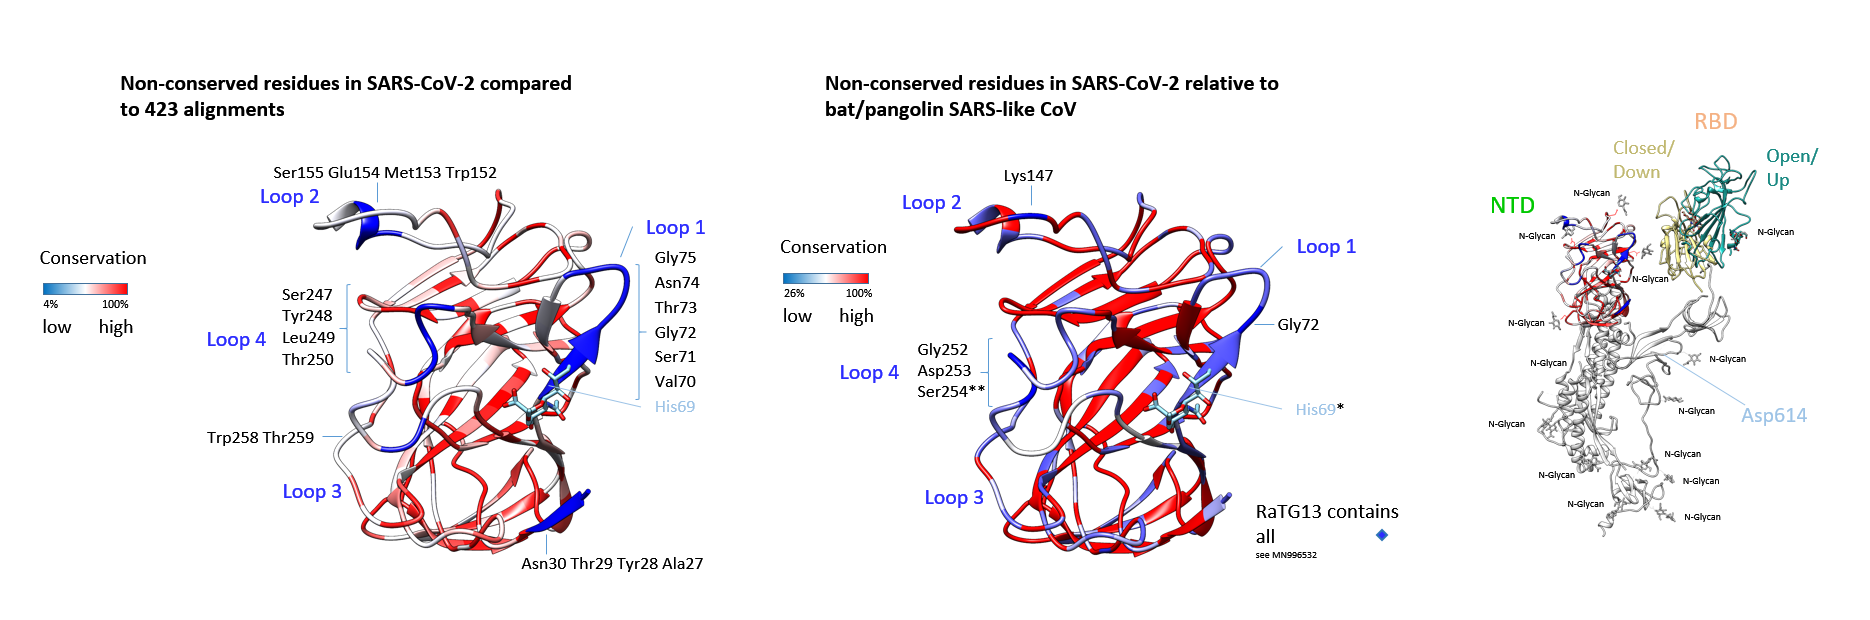
Figure 2: Coronavirus S protein NTDs: Would glycans interact?The TBLASTN search (22 March 2020, default parameters) yielded 429 coronaviridae genomic sequence hits at cut-off 33.3% identity and a maximal score for ranking. Only complete N-terminal domain sequences were aligned and conservation relative to MN908947 (Wuhan-Hu-1) was calculated. Structural residues of low conservation are indicated in dark blue. The other residues coloured in light and dark red are increasingly conserved (identity scale matrix). The sialylated group is grafted in analogous location to the HCoV-OC43. The structure is derived from 6nzk to demonstrate the surrounding amino acids of the putative ligand binding-site. Other strains corresponded to SARS human and Asian bat, SARS-like bat/pipistrellus and pangolin, and the SARS viridae found in civet, the African Zaria bat (Nigeria) similar to Ghana-CoV, BtKY72-CoV (Kenya) and Bt SARS-like CoV (Bulgaria). Key residues that were non-conserved (or replaced) in the proposed species barrier crossing are displayed. The isolate from the currently identified proximate to human RaTG13 virus (MN996532) does include all amino acid residues in the insertions/loops shown. Shown overlay indicates the alignment in Supplementary Fig. 2 omitting HcoVs (identity scale matrix). His69 and Ser254 are labelled with asterisks. The lectin domain was modelled with the Swiss-Model server and placed concatenated to the C-terminal S1 RBD and S2 in its original position (6vsb). The conservation values are shown as in (A). Low level of conservation in corresponds to deletion in all or most non-Wuhan-Hu-1 strains. The receptor-binding domain is shown in both conformations that were determined in the following publications (1) and (11), and reconstructed for overlays linked to 6vsb.
The TBLASTN search (22 March 2020, default parameters) yielded 429 coronaviridae genomic sequence hits at cut-off 33.3% identity and a maximal score for ranking. Only complete N-terminal domain sequences were aligned and conservation relative to MN908947 (Wuhan-Hu-1) was calculated. Structural residues of low conservation are indicated in dark blue. The other residues coloured in light and dark red are increasingly conserved (identity scale matrix). The sialylated group is grafted in analogous location to the HCoV-OC43. The structure is derived from 6nzk to demonstrate the surrounding amino acids of the putative ligand binding-site. Other strains corresponded to SARS human and Asian bat, SARS-like bat/pipistrellus and pangolin, and the SARS viridae found in civet, the African Zaria bat (Nigeria) similar to Ghana-CoV, BtKY72-CoV (Kenya) and Bt SARS-like CoV (Bulgaria). Key residues that were non-conserved (or replaced) in the proposed species barrier crossing are displayed. The isolate from the currently identified proximate to human RaTG13 virus (MN996532) does include all amino acid residues in the insertions/loops shown. Shown overlay indicates the alignment in Supplementary Fig. 2 omitting HcoVs (identity scale matrix). His69 and Ser254 are labelled with asterisks. The lectin domain was modelled with the Swiss-Model server and placed concatenated to the C-terminal S1 RBD and S2 in its original position (6vsb). The conservation values are shown as in (A). Low level of conservation in corresponds to deletion in all or most non-Wuhan-Hu-1 strains. The receptor-binding domain is shown in both conformations that were determined in the following publications (1) and (11), and reconstructed for overlays linked to 6vsb.
Of highest interest with respect to transmissibility, are the residues in positions 252-254 Gly-Asp-Ser of high variability, displayed in Fig. 2. Indicated by the alignment, the TBLASTN sequence result shows frequently a gap of 6 amino acids in this area, these are distributed and encompass the Gly-Asp-Ser on closer inspection. They are adjacent to the loop residues Trp258-Thr259 of overall negligible conservation but are found to be conserved and mutationally inserted in the strain Wuhan-Hu-1 as well as in RaTG13. They may have fully switched to human adaptation: The RaTG13 virus carbohydrate interaction would have bridged species and order barriers since the bat host is in particular known to display human-like as well as non-human-like (less prevalent) glycans on the surface of the respiratory tract (24, 25) (SA (sialic acid) α2,6-Gal/SA α2,3-Gal). Only one residue out of eight is absolutely conserved in the carbohydrate-interacting residues of Wuhan-Hu-1 S NTD relative to the HCoV-OC43 S NTD and two are replaced conservatively. Not this loop alone, but also all other altered residues could be directly or indirectly involved to fit an altered glycan. The distance of the Ser254 to aligned His69 within the putative carbohydrate binding residues is 10 Å (15 Å distance of the Cα). In influenza virus, as an example, mutation of these residues in the neighbourhood of the glycan binding site is known to affect growth and likely represents an evolutionary advantage (26). Moreover, the compensation of reduced replication of influenza viruses due to key residue exchange by peripheral mutation had previously been analysed in a laboratory (27). Whether similar replacements in SARS-CoV-2 or in its lineage could cause altered functions is hitherto not known.
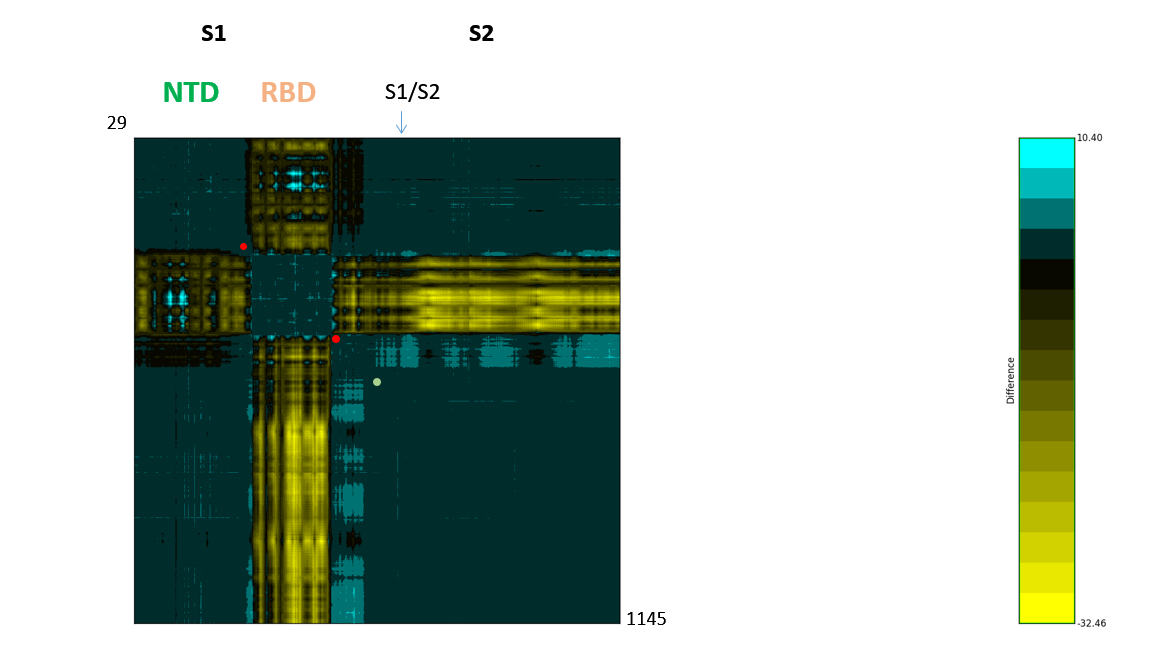
Figure 3: The SARS-CoV-2 S dynamicsDifference map of 6vyb and 6vxx RBD up/open and down/closed structure. Asp614 is indicated by a green dot. The highly mobile receptor-binding domain (RBD) and N-terminal domain (NTD) are labelled. In the spike protein, the receptor-binding interface is swung upwards in a hinge movement that may centre on the area including Asp614, the proposed pivot is labelled with red dots (residues in direct neighbourhood of and including Asp614). These can be seen also by structural morphing.
Difference map of 6vyb and 6vxx RBD up/open and down/closed structure. Asp614 is indicated by a green dot. The highly mobile receptor-binding domain (RBD) and N-terminal domain (NTD) are labelled. In the spike protein, the receptor-binding interface is swung upwards in a hinge movement that may centre on the area including Asp614, the proposed pivot is labelled with red dots (residues in direct neighbourhood of and including Asp614). These can be seen also by structural morphing.
The origin of human viral isolates used here is shown in and denotes countries where SARS-CoV-2 collections were started. When aligning 429 complete SARS-CoV-2 spike sequences by MEGA X (28) and analysing for NTD amino acid mutations (Table 1), it is found, that three small deletions (Gly107Del, Val143Del, Tyr145Del) in different sub-strains accumulated (Val143Del is from an ambiguous sequence). Moreover, several substitutions are found that co-segregate with the two sub-strains early derived, the Asp614 prevalent in China and the Gly614 found to some extent there and in other countries: The Leu54Phe and Gly107Del co-segregate with Gly614, all others with the Asp614 (Fig. 4). This description refers to the NTD variations that co-segregate with the change in residue 614 that locates to the inter-S1-RBD-S2 area (Figs. 2, 4). The sub-strains Asp/Gly 614 are not identical to previously described L- or S-type strains that show alterations in ORF1ab and ORF8 (8). Although encoded as L-type in the originating isolate MN908947/NC045512 it was not clarified whether the L- or S-type is more related to a common ancestor. In the representative alignment of 200 DNAs used in the present analysis from 107 Asp614 and 93 Gly614 sub-strains from a NCBI sequence set, 14% of the former and all of the latter viral sub-strains remain in the L-type. This would indicate (molecular clock below) that the L-type, when exemplarily judged by the S protein, is correlating with and may form the origin of one of the latest viral sub-strains generated, the Asp614Gly (see below Fig. 8). The Gly251Val mutants found in ORF3a (29) form 4% of the L-type strain/"clade I" as detected by sequence in the reference set; these sub-strains belong to the Asp614-type. To visualize these sequences use the sequence download and link to the multiple sequence alignment page.
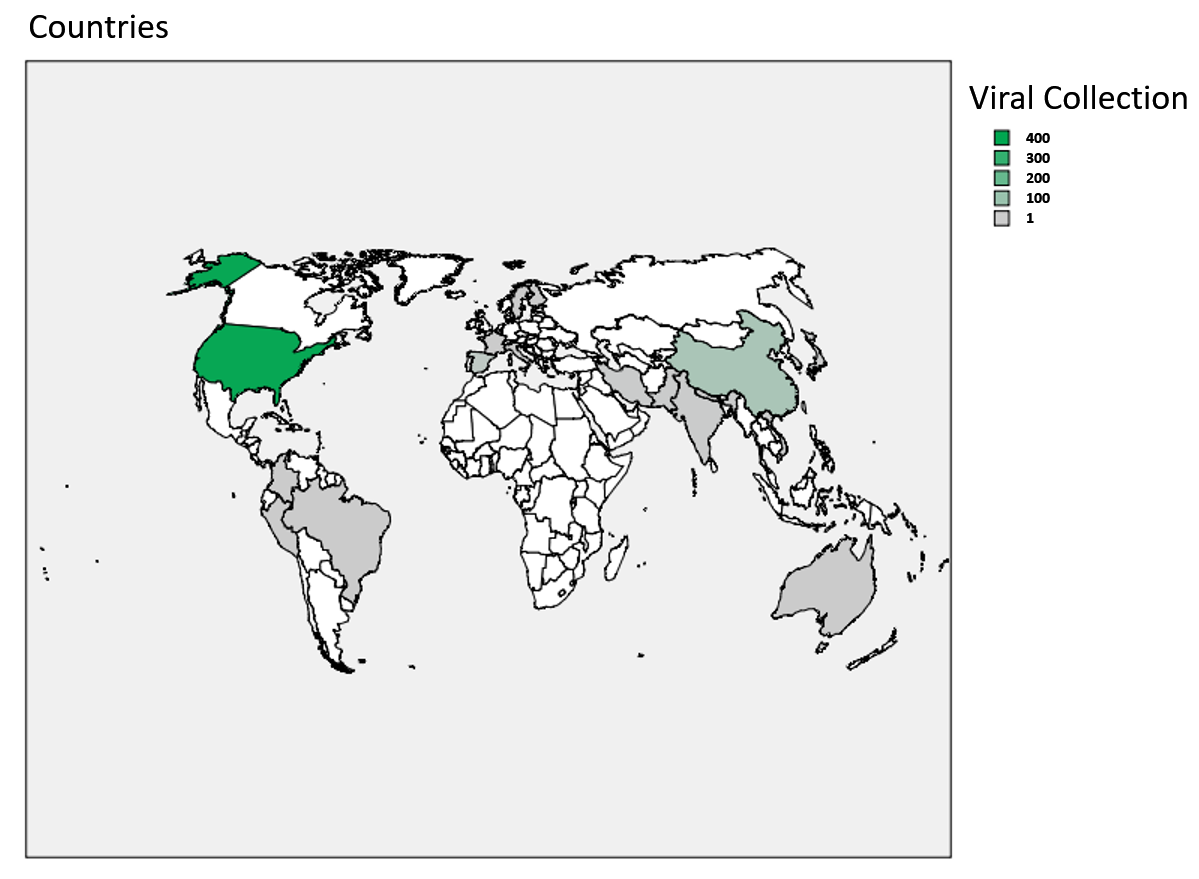
Supplementary Fig. 4: Origin of viral isolates. 507 sequences/isolations are indicated.
| S | Sub-Strain | Sub-Strain |
| Domain | Asp614 | Gly614 |
| NTD | 23 | 12 |
| RBD | 8 | 1 |
| Rest | 11 | 18 |
| Total | 43 | 32 |
| S | Sub-Strain | S | Sub-Strain | ||
| Domain | Asp614 | No. | Domain | Gly614 | No. |
| NTD | Leu5Phe | 5 | NTD | Leu54Phe | 1 |
| NTD | Ala27Val | 1 | NTD | Gly107Del | 1 |
| NTD | Tyr28Asn | 1 | S2 HR1 | Asp936Tyr | 1 |
| NTD | Thr29Ile | 1 | |||
| NTD | His49Tyr | 2 | |||
| NTD | Ser50Leu | 1 | |||
| NTD | Asn74Lys | 1 | |||
| NTD | Glu96Asp | 1 | |||
| NTD | Asp111Asn | 1 | |||
| NTD | Val143Del | 1 | |||
| NTD | Tyr145Del | 1 | |||
| NTD | Phe157Leu | 1 | |||
| NTD | Gly181Val | 1 | |||
| NTD | Ser221Trp | 1 | |||
| NTD | Thr240Ile | 1 | |||
| NTD | Ser247Arg | 1 | |||
| RBD | Ala348Thr | 1 | |||
| RBD | Arg408Ile | 1 | |||
| RBD | Gly476Ser | 1 | |||
| RBD | Val483Ala | 1 | |||
| RBD | His519Gln | 1 | |||
| RBD | Ala520Ser | 1 | |||
| Rest S1 | Ala570Val | 1 | |||
| Rest S2 | Phe797Cys | 1 | |||
| S2 HR1 | Ala930Val | 1 | |||
| S2 HR2 | Ala1078Val | 1 | |||
| Rest S2 | Asp1168His | 1 | |||
| CT S2 | Asp1259His | 1 |
Table 1: and summary of 1109 RNA sequences and amino aicd residue mutations of SARS-CoV-2 Replaced amino acids in spike S-glycoprotein identified in this study. The table (Result Button) shows 507 sequences analysed. They were selected for complete sequence reads and amounted to 429 aligned sequences. The summary (top) is derived from 1109 sequences that did not include short sequence reads but did include the ambiguous base calls (some sequences showed 6-8 amino acid changes that were ignored in this summary since likely due to low quantity of isolated RNA).
Replaced amino acids in spike S-glycoprotein identified in this study. The table (Result Button) shows 507 sequences analysed. They were selected for complete sequence reads and amounted to 429 aligned sequences. The summary (top) is derived from 1109 sequences that did not include short sequence reads but did include the ambiguous base calls (some sequences showed 6-8 amino acid changes that were ignored in this summary since likely due to low quantity of isolated RNA).
The very N-terminal residues from 1 to 26 have not been structurally resolved in the SARS-CoV-2 S protein (6vsb). Signal-sequence cleavage would produce a mature N-terminus that extends a further 16-39 Å. These amino acids could principally form contacts that include inter-domain interactions within one S protein or intra-timer interactions, but may be mobile and/or fold onto the NTD itself analogous to in HCoV-OC43. In the 6nzk structure of HCov-OC43 these N-terminal amino acids form or open up the binding site and attach N-termini of the trimers to each Val70-Asn74 loop that is juxtaposed in the Swiss-Model (Fig. 2). Also in SARS-CoV these residues would be similarly positioned. The loop 1 would, however, be short.
Figure 4: Amino acid changes of the SARS-CoV-2 S proteinConservation of amino acids residues in the N-terminal lectin and receptor-binding domain of SARS-CoV- 2. Sequences downloaded from Genbank (507) on 14 April 2020 were analysed. The alignment was carried through with CLUSTAL in MEGA X (28). All conserved residues (annotated sequences) in the NTD are shown in red, less conserved or deleted amino acids are shown in blue (with identity scale matrix). The sialylated group is grafted in analogous location to the HCoV-OC43. The structure is derived from 6nzk to demonstrate the surrounding amino acids of the putative ligand binding-site. Below the overlay of conservation is demonstrated for the RBD with altered residues indicated and placed onto 6m17 (11). The number of substitutions or deletions is shown in Table 1 for both, the NTD (Val143Del is included although found in a sequence with ambiguities) and RBD. The Signal-Sequence (SS) residue that is mutated is indicated; the length of the mature N-terminus is extended by 16 - 39 Å. The phylogenetic tree is generated from aligned sequences of the S spike glycoprotein (429 sequences were complete). The tree was generated with MEGA X 10 using the Neighbour-Joining method. Bootstrapping estimates the likelihood (1000) of branch formation (50%-100%) and is schematically indicated next to branches; the tree was condensed. The early branch point is labelled: Asp614 (marked in A) is found in most isolates from China and Gly614 in a sub-group of early isolated SARS-CoV-2s, and many later forms (according to nextstrain.org). Whether a His substitution by Asp at position 69 (found once by GISAID) could functionally replace a carbohydrate-binding residue is unclear but due to a pK towards the acidic it seems conservative.
Conservation of amino acids residues in the N-terminal lectin and receptor-binding domain of SARS-CoV- 2. Sequences downloaded from Genbank (507) on 14 April 2020 were analysed. The alignment was carried through with CLUSTAL in MEGA X (28). All conserved residues (annotated sequences) in the NTD are shown in red, less conserved or deleted amino acids are shown in blue (with identity scale matrix). The sialylated group is grafted in analogous location to the HCoV-OC43. The structure is derived from 6nzk to demonstrate the surrounding amino acids of the putative ligand binding-site. Below the overlay of conservation is demonstrated for the RBD with altered residues indicated and placed onto 6m17 (11). The number of substitutions or deletions is shown in Table 1 for both, the NTD (Val143Del is included although found in a sequence with ambiguities) and RBD. The Signal-Sequence (SS) residue that is mutated is indicated; the length of the mature N-terminus is extended by 16 - 39 Å. The phylogenetic tree is generated from aligned sequences of the S spike glycoprotein (429 sequences were complete). The tree was generated with MEGA X 10 using the Neighbour-Joining method. Bootstrapping estimates the likelihood (1000) of branch formation (50%-100%) and is schematically indicated next to branches; the tree was condensed. The early branch point is labelled: Asp614 (marked in A) is found in most isolates from China and Gly614 in a sub-group of early isolated SARS-CoV-2s, and many later forms (according to nextstrain.org). Whether a His substitution by Asp at position 69 (found once by GISAID) could functionally replace a carbohydrate-binding residue is unclear but due to a pK towards the acidic it seems conservative.
Variability in the S-Protein N-Terminal Domains
In the previous outbreak of SARS some distinct variation can be seen in the publicly available sequence entries of viral isolates (Fig. 2) - and antigenic drift in SARS just as in COVID-19 could be attributed to variability in the NTD that is now visible in the SARS-CoV-2 evolution (Fig. 4). The Asp614Gly exchange, that is found 124-fold, could display evolutionary advantages by amino acid replacement if these would functionally alter RBD and/or NTD exposure towards the cell. There kinetics and avidity of binding could be changed. So far, no mutation in the NTD is associated with a secondary mutation. Thus, no amino acid replacement compensates for altered function and can be found in proximity of the first altered residue (summarized replacements, Table 1). The NTD residues that are variable are unique, and in the RBD, changes are neither seen to be compensated within the RBD (Fig. 4) or within the rest of the molecule (Fig. 5). All RBD changes co-segregate with the Asp614 sub-strain and none could be found in the complete sequences of the Gly614 sub-strain (Fig. 4 and 5). The Leu5Phe exchange found five times within the 429 genomes, is located to the cleaved signal sequence and could be of functional importance in protein membrane translocation. This mutation co-segregated with the Asp614 sub-strain and twice included the Gly476Ser exchange. The N-termini of the folding polypeptide are in direct proximity to the RBD or lever. Apart from effects on protein translocation it is unlikely that the mutation has impacted on folding intermediates.
Figure 5: The SARS-CoV-2 S protein: S1 and fusion apparatus of S2-domainConservation of amino acids in the inter-NTD-RBD, inter-S1-S2 and residual S2 domain in SARS-CoV-2. Sequences downloaded from Genbank (507) on 14 April 2020 were analysed. The alignment was used (CLUSTAL in MEGA X) to derive the number of mutations including deletions. All conserved residues in the S protein domains are shown in red, less conserved or deleted amino acids are shown in blue (non-linear, with identity scale matrix). The NTD and RBD are detailed in Fig. 4. SS (Signal-Sequence), S1/S2 junction, S2’ cleavage site, FP (fusion peptide), HR1 (Heptad-Repeat 1), CH (Central Helix), CD (Connector Domain), HR2 (Heptad-Repeat 2), TM (Transmembrane domain) and CT (Cytoplasmic Tail) are indicated. The codon in negative and purifying selection is labelled by its encoded amino acid Asn824. This locates next to the Fusion Peptide. The Thr791Ile named in positive selection is marked.
Conservation of amino acids in the inter-NTD-RBD, inter-S1-S2 and residual S2 domain in SARS-CoV-2. Sequences downloaded from Genbank (507) on 14 April 2020 were analysed. The alignment was used (CLUSTAL in MEGA X) to derive the number of mutations including deletions. All conserved residues in the S protein domains are shown in red, less conserved or deleted amino acids are shown in blue (non-linear, with identity scale matrix). The NTD and RBD are detailed in Fig. 4. SS (Signal-Sequence), S1/S2 junction, S2’ cleavage site, FP (fusion peptide), HR1 (Heptad-Repeat 1), CH (Central Helix), CD (Connector Domain), HR2 (Heptad-Repeat 2), TM (Transmembrane domain) and CT (Cytoplasmic Tail) are indicated. The codon in negative and purifying selection is labelled by its encoded amino acid Asn824. This locates next to the Fusion Peptide. The Thr791Ile named in positive selection is marked.
The fusion of the coronaviridae uses a loaded spring-type (class I) fusion mechanism where a helical heptad-repeat domain (HR1) with an N-terminal fusion-peptide (FP) penetrates the opposing plasma membrane to trigger merger of virus and cell. The Phe797Cys alteration in one viral sub-strain is proximal to the FP, two mutations in the HR1, one mutation in the connector domain (CD) and one mutation in the HR2 is completed by one additional change in the cytoplasmic-tail (CT) (Fig. 5). One mutation, Asp936Tyr, co-segregates with the Gly614 sub-strain, the Phe797Cys, Ala930Val, Ala1078Val, Asp1168His, Asp1259His mutations are found in the Asp614 sub-strains that arose from viral exposures from the Wuhan-Hu-1 SARS-CoV-2 index patient. None of these changes is found to complement within the viral strain that was subjected to sequencing. As a note of caution, clinical variations include sequencing reads of multiple base-calls and pleomorphisms. Complexity may increase (8), if these were detailed to approach 20%-50% of calls in singular cases and remain to be determined.
Estimates of the Mutation Frequencies
An estimate of the amino acid replacement frequency for the S protein is 6.0x10⁻⁵/5.2x10-5-3.1x10-4/4.7x10-4, for the S protein RBD 7.3x10⁻⁵/4.2x10-5-1.8x10-4/1.1x10-4 and NTD 1.4x10⁻⁴/9.9x10-5-1.8x10-4/1.5x10-4. This estimate is based on all 429 or 1109 amino acid sequences accumulated with the conservative lower estimate considering amino acid mutations only once. The lineages would be discerned to all be derived from the initial mutated sub-strain except for the Leu5Phe/Gly476Ser, which then included two to three reverted virus isolates. Several reversions are likely seen in the 1109 sequences: In total 34 double mutants and 3 triple mutants were found. The three-fold mutated SARS-CoV-2 sub-strains all are derived from the Gly614 sub-strains and with these, as well as with the double mutants, the parsimonious approach to amino acid counts is justified (Fig. 6). Cluster presentation shows that same mutants were derived from submission of the same centres. Two sequencing reads of SARS-CoV-2 showed 6 or 8 mutations each and have to be further studied. Likely the quantity was low and hindered the analysis of the complete RNA of the clinical isolates.
| Strain | Method | Protein | Ratio | ka/ks | Rate x104 |
| SARS-CoV-2 | Proteins | S | - | - | 1.8 |
| SARS-CoV-2 | RNAs | S | 9.1 | 2.5 | 18.0 |
| SARS-CoV-2 | RNAs | S | 3.7 | 1.0 | 15.7 | SARS-CoV-2 | RNAs | S | 5.3 | 0.7 | 1.3-5.2 |
| H1N1 | RNAs | HA | 0.9 | 0.2 | 281.1 |
Table 2: Predicted yearly rate of S-protein changesYearly estimated change of genomes. SARS-CoV-1 (SARS1), SARS-CoV-2 (COVID-19), and pandemic H1N1 influenza of swine flu is included.
Yearly estimated change of genomes. SARS-CoV-1 (SARS1), SARS-CoV-2 (COVID-19), and pandemic H1N1 influenza of swine flu is included.
The parsimonious approach yields a slightly lower mutation rate than expected from analysis of 200 representative genomes. When these are scrutinized for pairwise distances, the sample size corrected yearly rate would correspond to 2.9x10⁻³. When analysed for the S protein encoding nucleotides alone it is 10 fold larger than suggested by the parsimonious count (Table 2). The controlled modelling of Li et al. (30) was used as the basis for the maximal generation time estimate using the combined infectious and latency period of 7 days.
Figure 6: Centres of DNA analysis: SummaryCluster analysis. Centres are indicated as Seattle (1), Richmond (2), Atlanta (3), Salt Lake City (4) and Gujarat (5). 1109 sequence data were analysed. 1273 amino acids with point mutations are graphed, the number of sequenced isolates above 1 for the same centre is indicated next to the data points. Sequences QJC20714.1 and QIZ13371.1 are shown, but included 8 and 6 mutations, respectively, and are more likely unreliable.
Cluster analysis. Centres are indicated as Seattle (1), Richmond (2), Atlanta (3), Salt Lake City (4) and Gujarat (5). 1109 sequence data were analysed. 1273 amino acids with point mutations are graphed, the number of sequenced isolates above 1 for the same centre is indicated next to the data points. Sequences QJC20714.1 and QIZ13371.1 are shown, but included 8 and 6 mutations, respectively, and are more likely unreliable.
Comparison with Flu Virus
To compare the SARS-CoV-2 viruses to the hemagglutinin (HA) mutation rate of flu virus, 970 representative sequences were used in an alignment: Using the same estimated generation time for the influenza H1N1 of the 2009 pandemic, a sample size corrected rate of 6.1x10⁻² was found. This compares to the estimated value of 2.0x10⁻³ for the SARS-CoV-2 S encoding nucleotides, both values are determined at 99% partial deletion cut-off to exclude ambiguous sequence calls (Table 2). The high mutation rate of the influenza virus in comparison to other RNA viruses is expected and is likely exceeded by the rate of the pandemic strain. The early determination of yearly mutation rates may not exactly correspond to the values that may be determined in a years' time. They may, yet, inform on the full spectrum of variability that is found in the infectious phase.
In overall comparisons of sequence codon use, the three viridae SARS-CoV-2, SARS-CoV and influenza H1N1 were studied for select inclusion of biased triplets. The pattern of the S gene nucleotide composition corresponded to an increased incorporation of the unequally used codons which were elevated by 3.6% in SARS-CoV and by 5.6% in SARS-CoV-2 with respect to influenza H1N1. The SARS-CoV-2 use of codons within the 3-4 months of sequence collections has not radiated towards unexpected preference: 1108 sequences including sequence ambiguities resulted in a slightly different relative usage with AAG (Lys) switched to AAA (Lys), GAC (Asp) to GAU (Asp) and GGU (Gly) to GGA (Gly) (Table 3). These sequences were compared to and included sequences of the NC045512 reference strain. The U-contents in the third position was conserved and slightly decreased (Fig. 7). The nucleotide substitution was analysed for the 1108 sequences in 3822 nucleotide positions and resulted in a distance of 25.7x10⁻⁵ in all, 9.4x10⁻⁵ in position 1, 45.2x10⁻⁵ in position 2 and 17.6x10⁻⁵ in position 3. Moreover, the overall composition of TCAG was determined and graphed in comparison to the reference isolated from the outbreak in 2019. The occurrence of T(U) contents in the 1109 sequences of S has not changed whereas the CAG contents has altered since then. Variations in T(U)CAG contents are clearly biased towards the position 2. Variances graphed in Fig. 7 indicate, that these are highest in positions 2 and 3 of S encoding RNAs. The S genomic sequences are here found to be highly elevated in U contents over the entire sequence with 33.25% U, 18.92% C, 29.43% A and 18.39% G. Compared to the summed genomic contents it differed only little. The genomic contents of U was 32.11%, of C 18.36%, and of A and G 29.91% and 19.63%, respectively.
| Codon | Δ RSCU | Codon | Δ RSCU | Codon | Δ RSCU | Codon | Δ RSCU |
|---|---|---|---|---|---|---|---|
| UUU(F) | 0 | UCU(S) | 0 | UAU(Y) | 0 | UGU(C) | 0 |
| UUC(F) | 0 | UCC(S) | 0 | UAC(Y) | 0 | UGC(C) | 0 |
| UUA(L) | 0 | UCA(S) | 0 | UAA(*) | 0 | UGA(*) | 0 |
| UUG(L) | 0 | UCG(S) | 0 | UAG(*) | 0 | UGG(W) | 0 |
| CUU(L) | 0 | CCU(P) | 0 | CAU(H) | 0 | CGU(R) | 0 |
| CUC(L) | 0 | CCC(P) | 0 | CAC(H) | 0 | CGC(R) | 0 |
| CUA(L) | 0 | CCA(P) | 0 | CAA(Q) | 0 | CGA(R) | 0 |
| CUG(L) | 0 | CCG(P) | 0 | CAG(Q) | 0 | CGG(R) | 0 |
| AUU(I) | 0 | ACU(T) | 0 | AAU(N) | 0 | AGU(S) | 0 |
| AUC(I) | 0 | ACC(T) | 0 | AAC(N) | 0 | AGC(S) | 0 |
| AUA(I) | 0 | ACA(T) | 0 | AAA(K) | 0.01 | AGA(R) | 0 |
| AUG(M) | 0 | ACG(T) | 0 | AAG(K) | -0.01 | AGG(R) | 0 |
| GUU(V) | 0 | GCU(A) | 0 | GAU(D) | 0.01 | GGU(G) | -0.01 |
| GUC(V) | 0 | GCC(A) | 0 | GAC(D) | -0.01 | GGC(G) | 0 |
| GUA(V) | 0 | GCA(A) | 0 | GAA(E) | 0 | GGA(G) | 0.01 |
| GUG(V) | 0 | GCG(A) | 0 | GAG(E) | 0 | GGG(G) | 0 |
Table 3: Codon usage in 1109 S sequencesCodon usage in the SARS-CoV-2 genomic S RNA. The relative synonymous codon use (RSCU) and variation in 1108 sequences of SARS-CoV-2 relative to the reference NC045512 is shown, codons used preferentially in NC045512 are labelled green, up or down changes are marked red or blue, for the RSCU one was compared to all. The codon positions were 1274 for the reference and 1269 on average for the 1108 sequence entries.
Codon usage in the SARS-CoV-2 genomic S RNA. The relative synonymous codon use (RSCU) and variation in 1108 sequences of SARS-CoV-2 relative to the reference NC045512 is shown, codons used preferentially in NC045512 are labelled green, up or down changes are marked red or blue, for the RSCU one was compared to all. The codon positions were 1274 for the reference and 1269 on average for the 1108 sequence entries.
SARS-CoV-2 and First Selection of Sub-Types
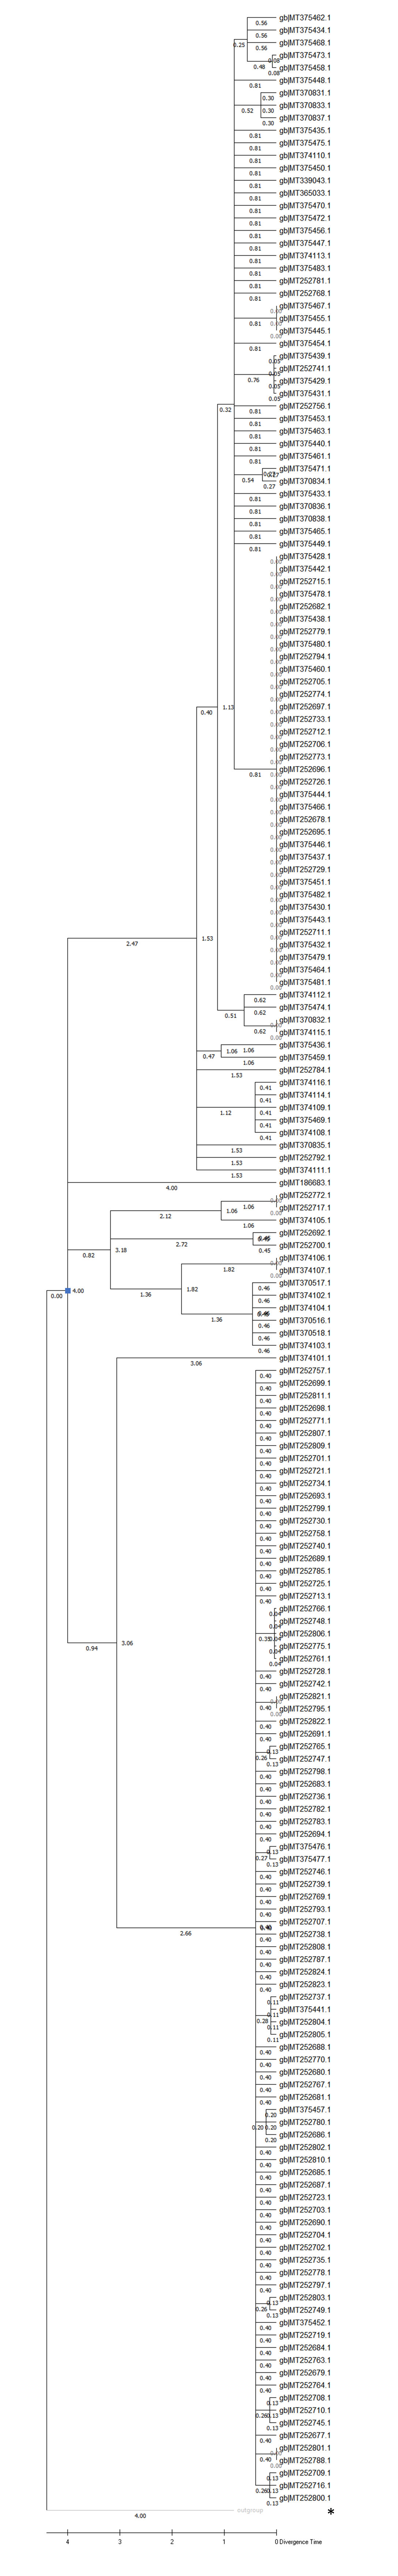
The DNA analysis of 200 representative alignments of the SARS-CoV-2 genomic RNA showed that only one sub-strain was in positive selection. The Fisher Exact test was used with the Nei-Gojobori method and had not shown any selection by applying the same analysis to the 1109 S-nucleotide sequences. The sub-strain corresponded to the Asp614 (MT252783) and contained a Thr791Ile mutation within the S protein that localizes close to the fusion apparatus (Fig. 5) and is N-terminal to the S2' cleavage site. This status of positive selection pertains relative to 12 sequences of Asp614-type that themselves do not show any amino acid changes in comparison to the reference (NC045512). Within this short time frame of sub-strain development no other significant results were obtained. The Fisher Exact test also yielded two sub-strains described in negative/purified selection, i.e. the MT374101 with a His49Tyr and Ser884Phe mutation (Fig. 4) as well as the MT252708 without any amino acid alterations. Both were of the Asp614 type. The double mutants and sub-strains remain to be followed-up.
Figure 7: TCAG-contents of the SARS-CoV-2 S geneTCAG-contents. The T(U), C, A, G contents of the 1108 nucleotide sequences of the S protein from 26 April was determined and compared to the NC045512 reference sequence. The difference of distances with their variance is graphed.
TCAG-contents. The T(U), C, A, G contents of the 1108 nucleotide sequences of the S protein from 26 April was determined and compared to the NC045512 reference sequence. The difference of distances with their variance is graphed.
The SLAC (Single-Likelihood Ancestor Counting) was used to determine sequence positions that would underlie a positive or negative selection. No codon does yet reach statistical significance at the p<0.05 cut-off and is from the 1109 aligned S spike. It may be expected, that two codons may reach significance and are currently at p<0.3 (31). The Asn824 codon within the FP shows purifying selection with p=0.08 (dN-dS∼-66) and the Asp614 changes to Gly614 tend towards positively selected sub-strain formation with a p=0.30 (dN-dS∼51).
Just as in SARS-CoV evolution at DNA-, SARS-CoV-2 may reach a purification at the protein-level and this may be an early indicator: Equilibrium of sub-strains in the later period is currently observable, at the time of summarizing the 507 protein and 1109 protein/DNA sequences, the odds ratio for mutations can presently be considered to be 0.22 (CI 95% 0.05-0.87) in the Gly614 sub-strain for the small sub-set of entries. Should the identical value be computed for the larger set, the odds for the Gly614 fall below the statistical significance. However, should the odds ratio be evaluated for the NTD plus RBD domain, the odds for the Gly614 sub-strain is presently low 0.40 (CI 95% 0.19-0.86).
Phylogenetic Analyses and Molecular Clocks in SARS-CoV-2s
Finally, a molecular model was applied to estimate the divergence of the Asp614 to Gly614 sequences independent of sample collections. This may also indicate whether the first sub-strains of the SARS-CoV-2 were identified instantaneously. RaTG13 strain from bat was included to aid in calibrations. The molecular clock was set to December for the reference strain with a 3 months delay period and results in the divergence of SARS-CoV-2 MT281577 in August. This would be considered to be three to four months before the 2019 outbreak. Yet, the programme alignments identify the sub-group to be due to an amino acid reversion, i.e. Ser50Leu, as demonstrated by the ancestral sequence. The protein data are listed in Supplementary Table 1, . Since the ancestral strain is identical to the arisen, the occurrence and divergence could be interchangeably used in its description; the singular event could not alter the hypotheses on a unique zoonotic transmission. The RaTG13 was dated back 129.0 months in this calibration, and to further determine the age of sub-strains the clock was set to 4 months for any SARS-CoV-2s that were hitherto sequenced: In these conditions, the RaTG13 was shown to be 69.2 months of age, the reference strain NC045512 was located to beginning of February 2020 and the Gly614 substitution mutant arose in the middle of February according to these estimates. The Maximum-Parsimony approach in phylogenetic and time analysis did not yield the appropriate result on the sub-strain formation when the RaTG13 strain was omitted, neither did the Maximum-Likelihood approach.
Supplementary Fig. 5: Phylogenetic tree and molecular timing of sequences. The alignment of 429 and 1 RaTG13 (MN996532) sequence of SARS-CoV-2 retrieved from Genbank were dated with the Molecular Clock. MEGA X settings in phylogenesis included a Jones-Taylor-Thornton substitution in a Maximum-Likelihood protein model dated to 4 months with a bootstrap with 200 tests. It should be noted, that few branches reach statistical significance at the 50% level. The branches to RaTG13 including the MT281577 reach some significance, and some other branches are also above cut-off. The branch point of RaTG13 and SARS-CoV-2’s was dated. The viral nucleotide replacement rate is likely elevated in the S protein and resulted in the pre-dating of the RaTG13 strain (or dating to an earlier stage should a lineage have been established) that is proposed as a common ancestor of the 2019 outbreak. NC045512 is indicated. The dated branch is labelled with a blue square.
Since these results on protein level analysis did not satisfy the submission dates of sequences, further genomic molecular clock analyses were used to determine strain divergence. RNA (or DNA) virus sequence data for the S spike protein obtained for 1108 SARS-CoV-2s when set to 4 months of sub-strain radiation show the divergence of Asp614Gly sub-strains at 2.1 months of delay (not shown). Moreover, the complete set of reference alignments of 200 full RNA genomic sequences resulted in the consistent observation that the back-dating of all G nucleotide-Gly614 sub-strains was to 2.5 months . This may be consistent with the reference strain collection and suggests, that the divergence of the pandemic Gly614 sub-strain according to DNA data occurred in the beginning and/or end of February. Stochastic spiking of sub-strains as seen in submitted DNA data (www.datamonkey.org) is not being accounted for. The DNA molecular clock seems to be more reliable than the S protein data alone. When the reference sequence NC045512 was doubled in the phylogenetic tree to allocate it to the outgroup and lineage tree, little changes were found for the back-dating. Moreover, the error bars would be indicative of that the divergence of the S-type virus ("Clade II") could not be precisely determined and equally well could approach the root of the tree, by using this select method.
Supplementary Fig. 6: Phylogenetic tree and molecular timing of full genomic sequences. The alignment of 200 sequences including the reference (NC045512) sequence of SARS-CoV-2 were dated with the Tamura-Nei model. MEGA X settings in phylogenesis included a Maximum-Likelihood method with a bootstrap with 100 tests. The NC045512 was located to the outgroup, 4 months of time delay to middle of April was set for the root labelled with a blue square. NC045512 is indicated.
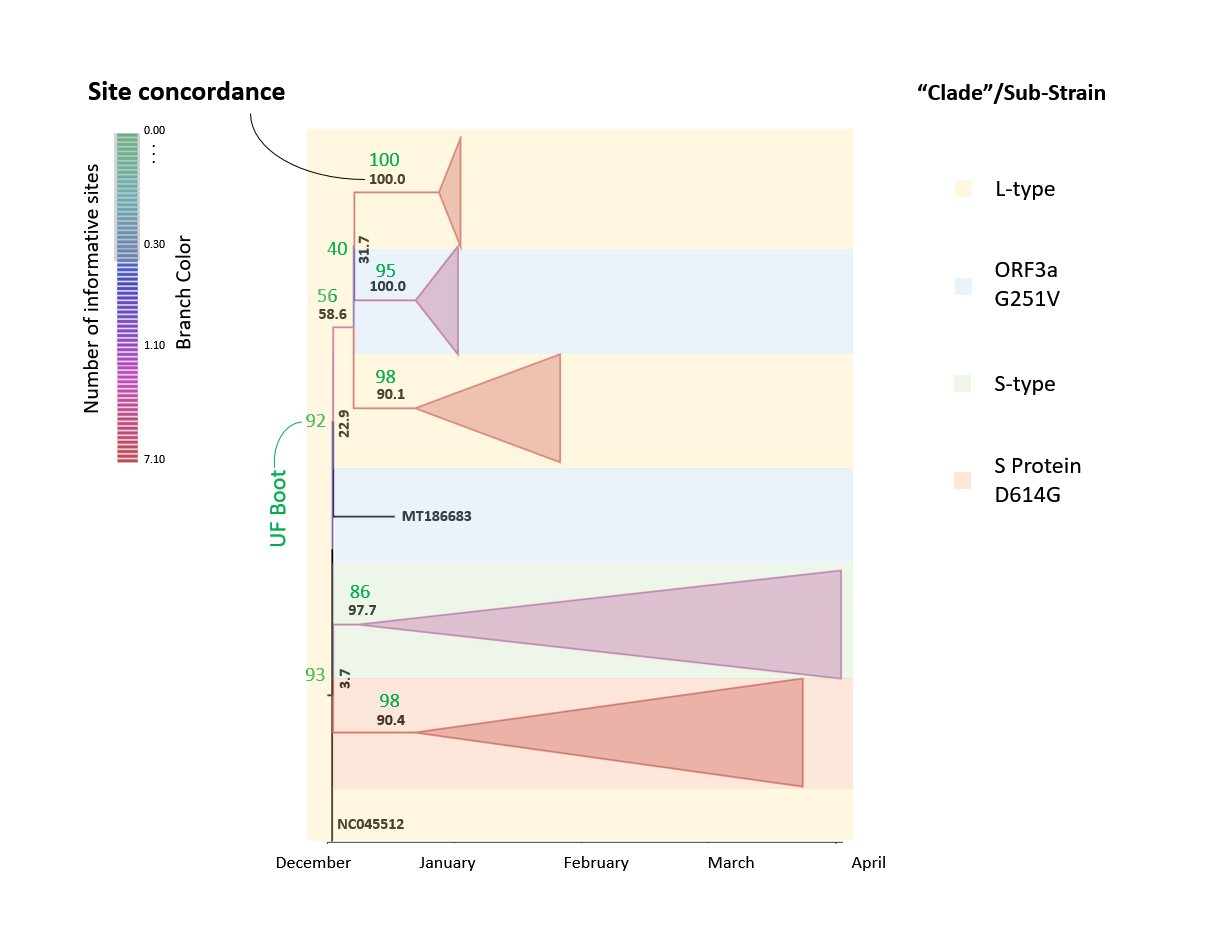
Figure 8: Phylogenetic tree of SARS-CoV-2 using the site concordanceThe set of 1109 SARS-CoV-2 sequences was applied to phylogenetic analysis with a Tamura-Nei +F +I model (empirical frequency, invariable sites) chosen according to the Bayesian information criterion with the selected set of 200 unique sequences. The L-type ("Clade I") was described as 8782 C in ORF1ab and 28144 T in ORF8 whereas the S-type ("Clade II") shows a 8782 T in ORF1ab and 28144 C in ORF8. Branches are colored according to the number of informative sites which is currently from 0.00 sites within sub-trees to maximally 7.10. The site concordance factor (sCF=sCF_N/sN %) is used to mark the corresponding branches with "collapsed" sub-trees, and background color is applied according to the sub-strain types. No gradient of colors is used.
The set of 1109 SARS-CoV-2 sequences was applied to phylogenetic analysis with a Tamura-Nei +F +I model (empirical frequency, invariable sites) chosen according to the Bayesian information criterion with the selected set of 200 unique sequences. The L-type ("Clade I") was described as 8782 C in ORF1ab and 28144 T in ORF8 whereas the S-type ("Clade II") shows a 8782 T in ORF1ab and 28144 C in ORF8. Branches are colored according to the number of informative sites which is currently from 0.00 sites within sub-trees to maximally 7.10. The site concordance factor (sCF=sCF_N/sN %) is used to mark the corresponding branches with "collapsed" sub-trees, and background color is applied according to the sub-strain types. No gradient of colors is used.
Applying the site concordance test in judging the phylogenesis in the reference sequence set (used for handling)(Fig. 8) it can be directly demonstrated that, although a numerable number of sites is currently evaluated in the branches of the tree (branch color), the overall site concordance factor (sCF) is a low 3.7-22.9 proximate to the root. The site concordance only reaches values of 90.1-100.0 in more distant branches of the species tree. Moreover, the UFBoot values do not exceed 93 in the branches connected to the root and attain values of 100 in select sub-branches.
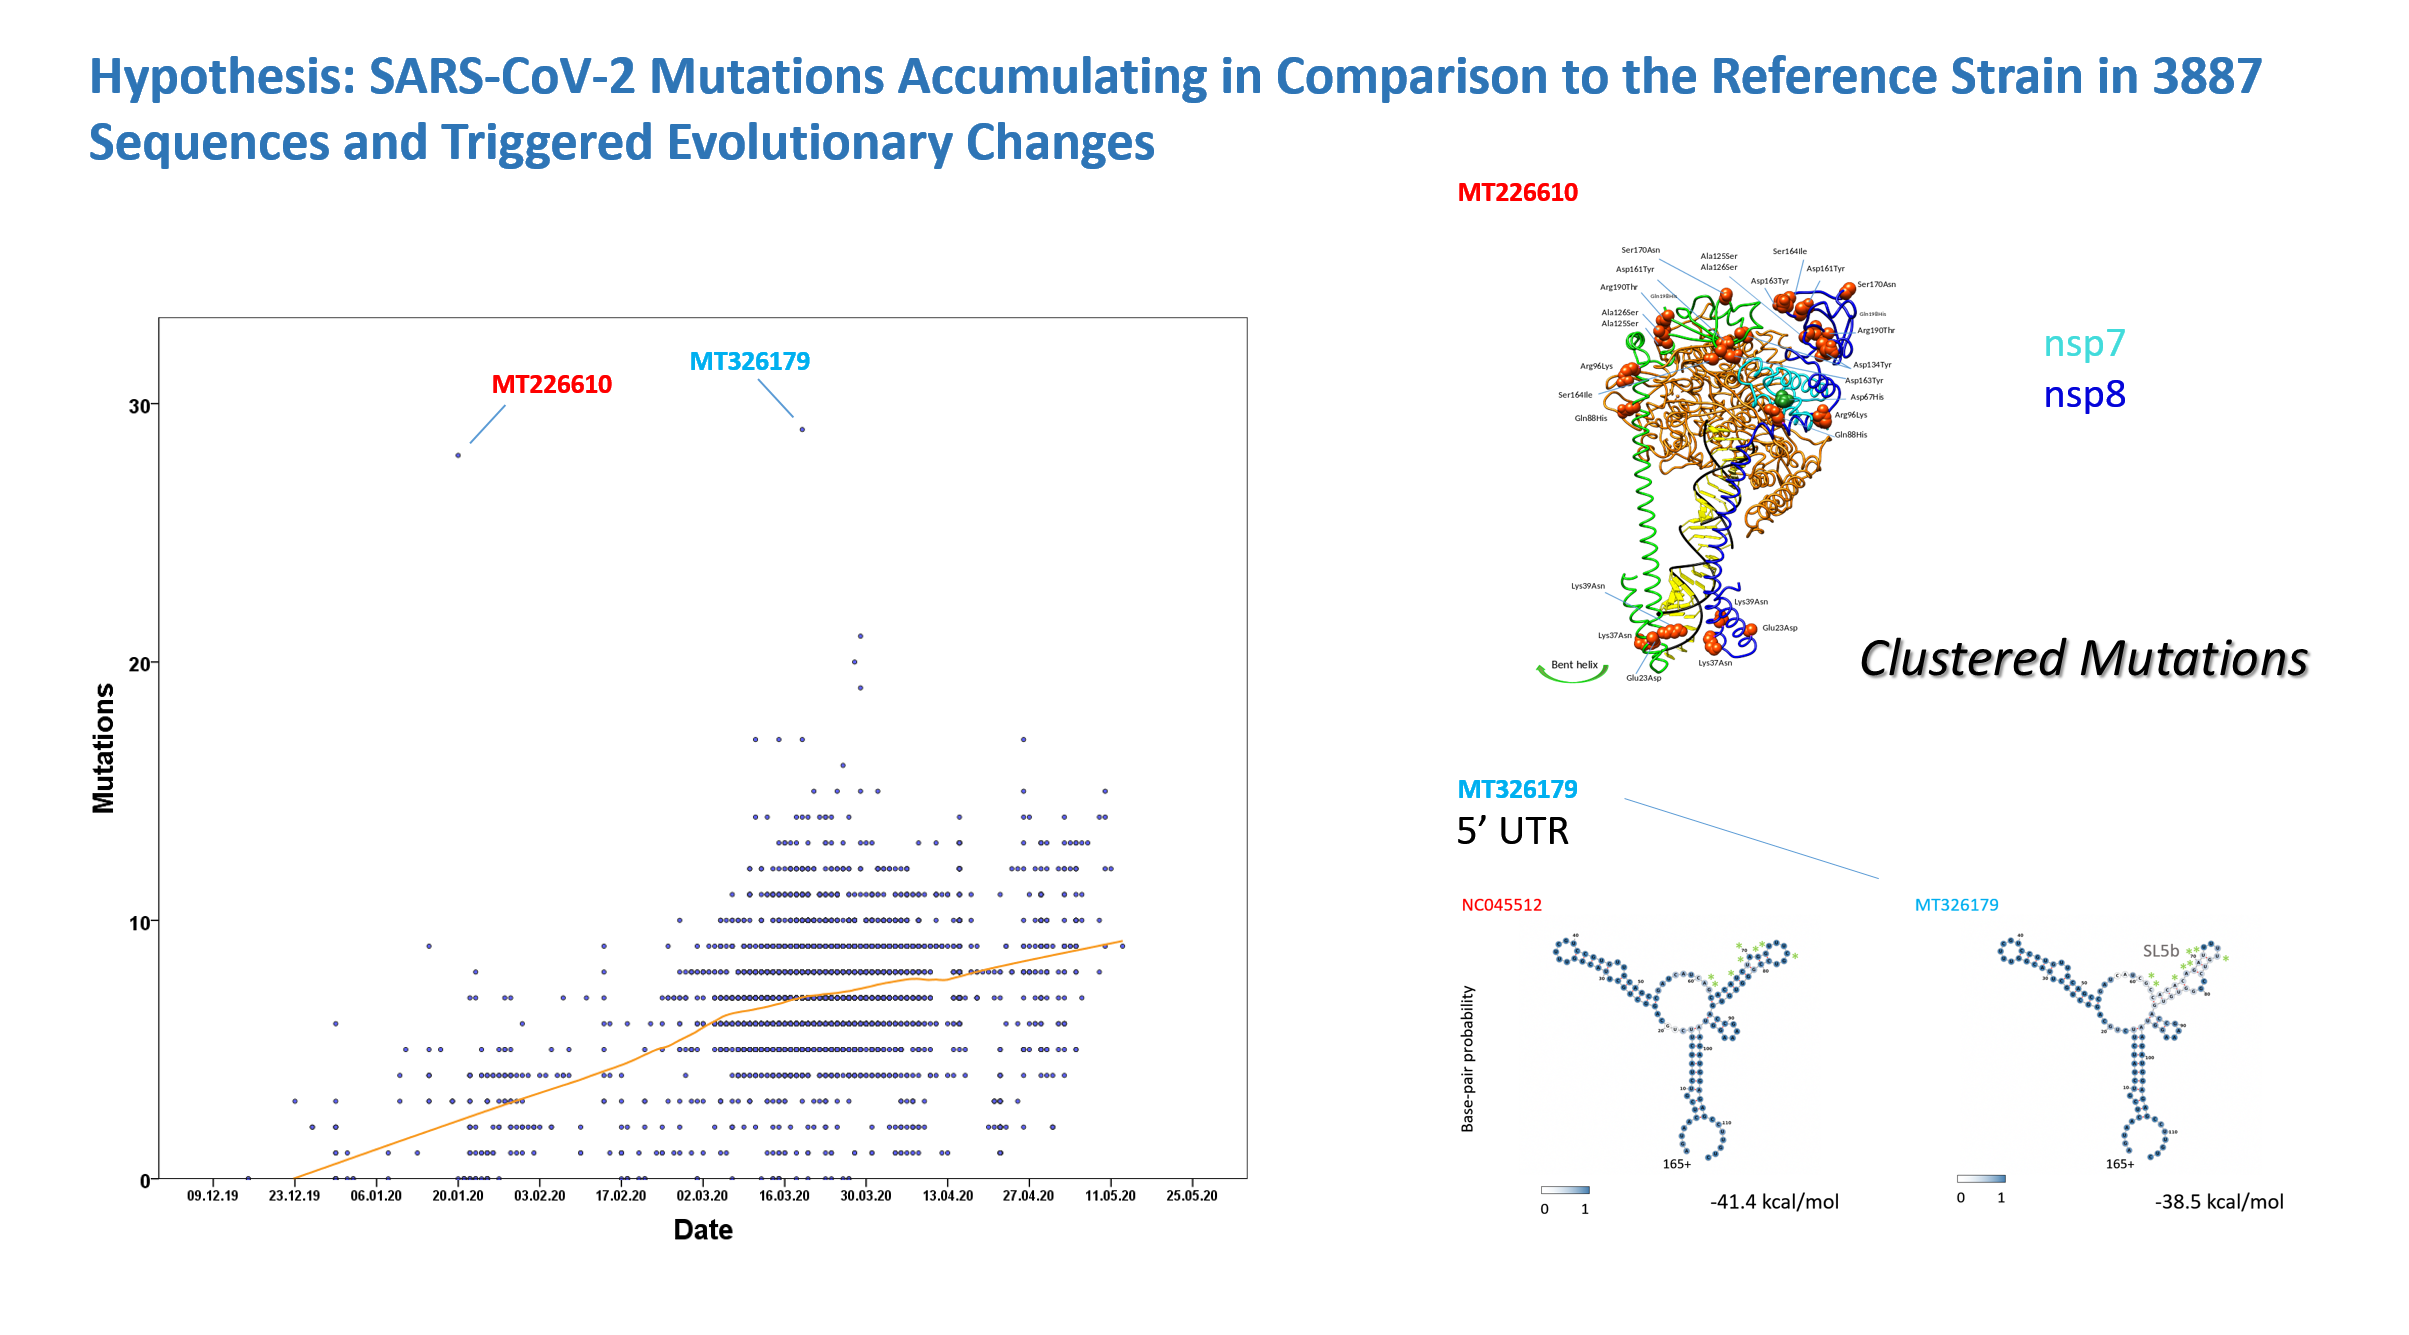
Figure 9: Mutations in 4557 (selected) SARS-CoV-2 sequencesThe sequences of SARS-CoV-2 were analysed for mutations, sequences were selected with a cut-off for ambiguities and sequences with primers were excluded. The sequences represent all known open reading frames and comparison refers to the reference sequence NC045512 from Wuhan (China) including the nucleotides 38-29834. When the day of sampling was not known the date was set to the middle of the month, two samples of 2020 remained undated. MT226610 is labelled. The sequence MT326179 with the top score of 29 mutations might have accumulated 8 mutations within the 5' UTR (untranslated region; green asterisks) 226-241 of the conserved SARS-CoV 5' UTR - the affected stem-loop SL5b is signified by surrounding SL5a and SL5c adjacent to the START from bases 182-268 which in the mutant may have abolished translation and possibly replication. Changes in MT226610 are shown in Table 4 and in MT326179 in Table 6.
The sequences of SARS-CoV-2 were analysed for mutations, sequences were selected with a cut-off for ambiguities and sequences with primers were excluded. The sequences represent all known open reading frames and comparison refers to the reference sequence NC045512 from Wuhan (China) including the nucleotides 38-29834. When the day of sampling was not known the date was set to the middle of the month, two samples of 2020 remained undated. MT226610 is labelled. The sequence MT326179 with the top score of 29 mutations might have accumulated 8 mutations within the 5' UTR (untranslated region; green asterisks) 226-241 of the conserved SARS-CoV 5' UTR - the affected stem-loop SL5b is signified by surrounding SL5a and SL5c adjacent to the START from bases 182-268 which in the mutant may have abolished translation and possibly replication. Changes in MT226610 are shown in Table 4 and in MT326179 in Table 6.
Last not least, setting the zoonotic species-barrier crossing to 3 months with protein analysis will yield a branch point at 53.4 months prior to the present (March 2020) which is likely consistent with the published study of Zhou et al. (4). If a direct lineage in the bat strain to human is constructed, molecular time is doubled. Since recombination presumably affected the S-gene of coronaviridae, and is considered by Wu et al. as the most plausible explanation to the (sub-)strain propagation (9), it is not feasible to prove the exact order without analysis of further intermediates and current viruses in the molecular time-model.
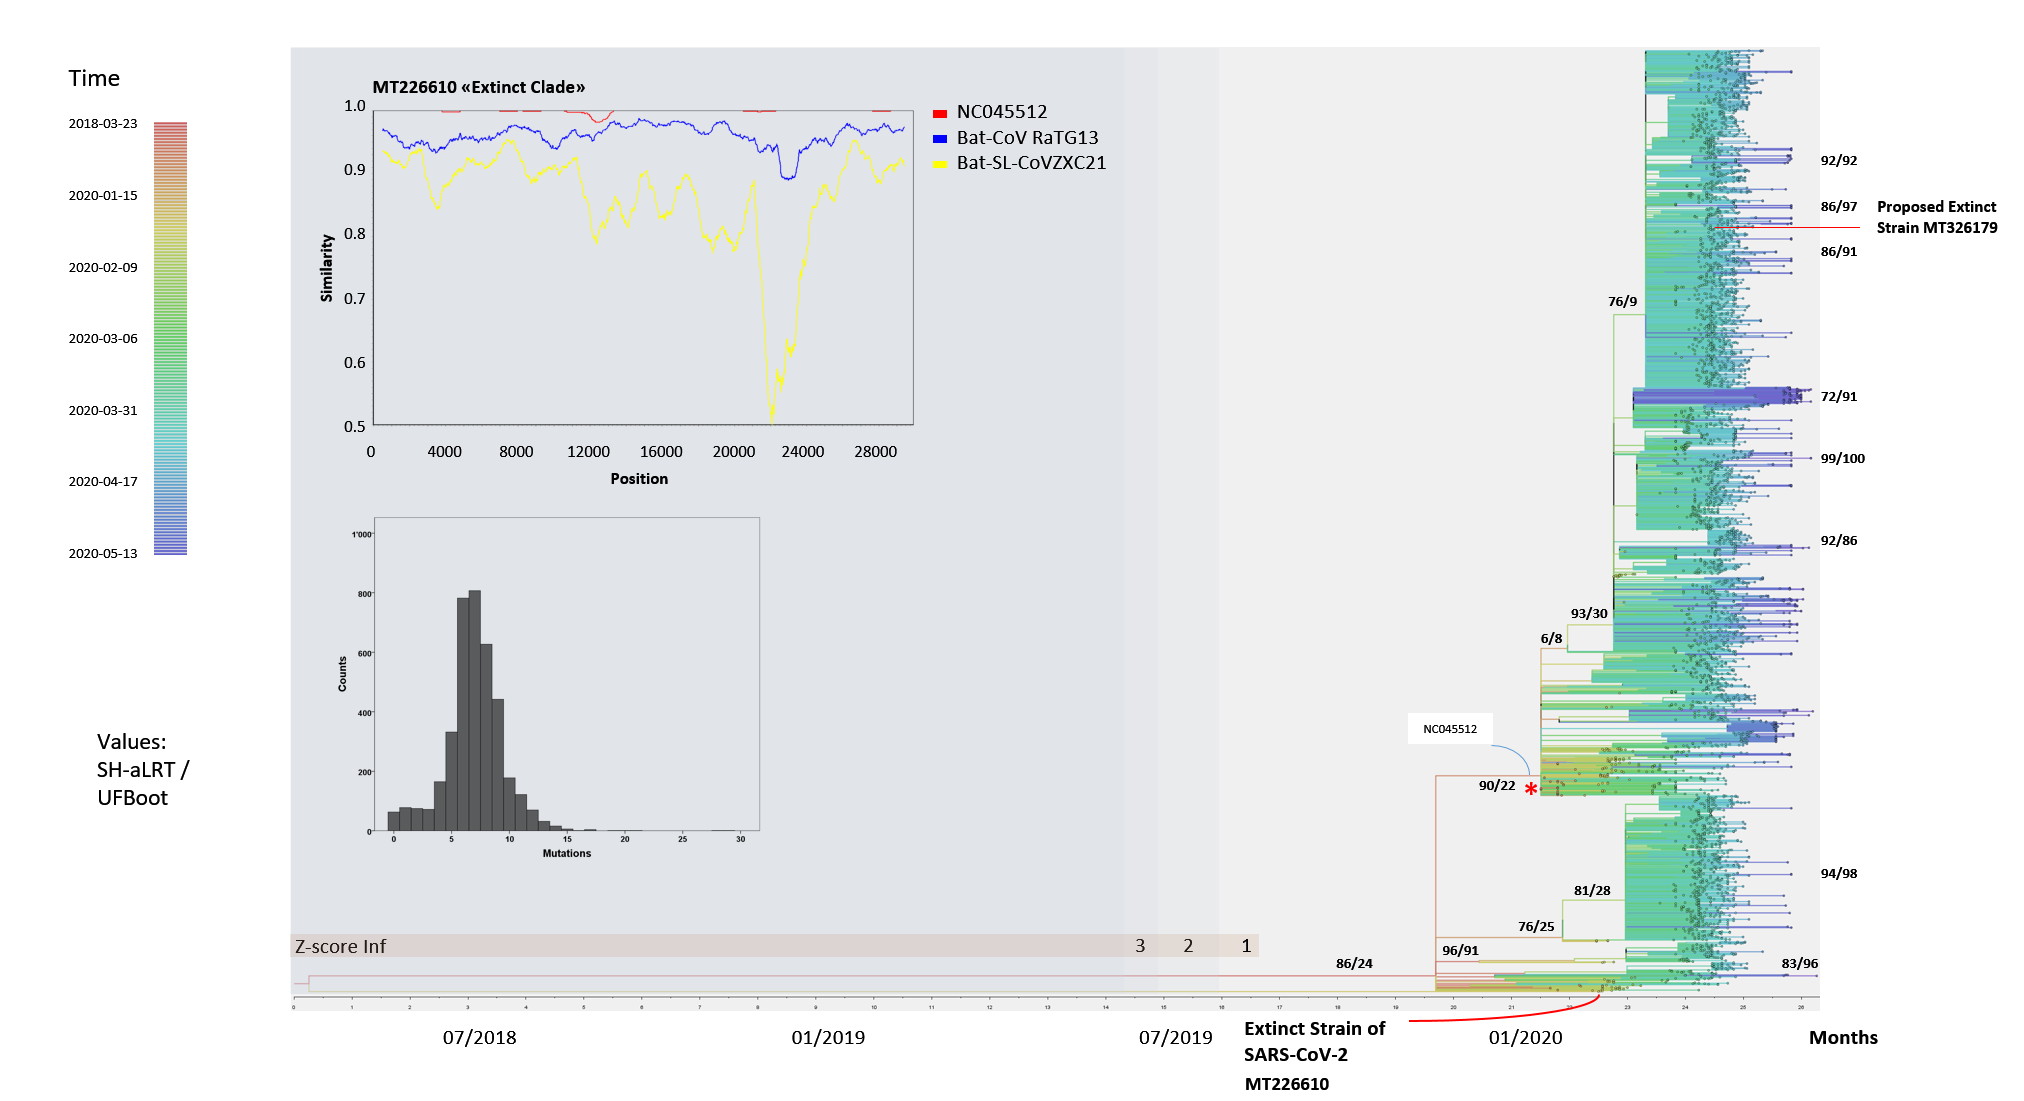
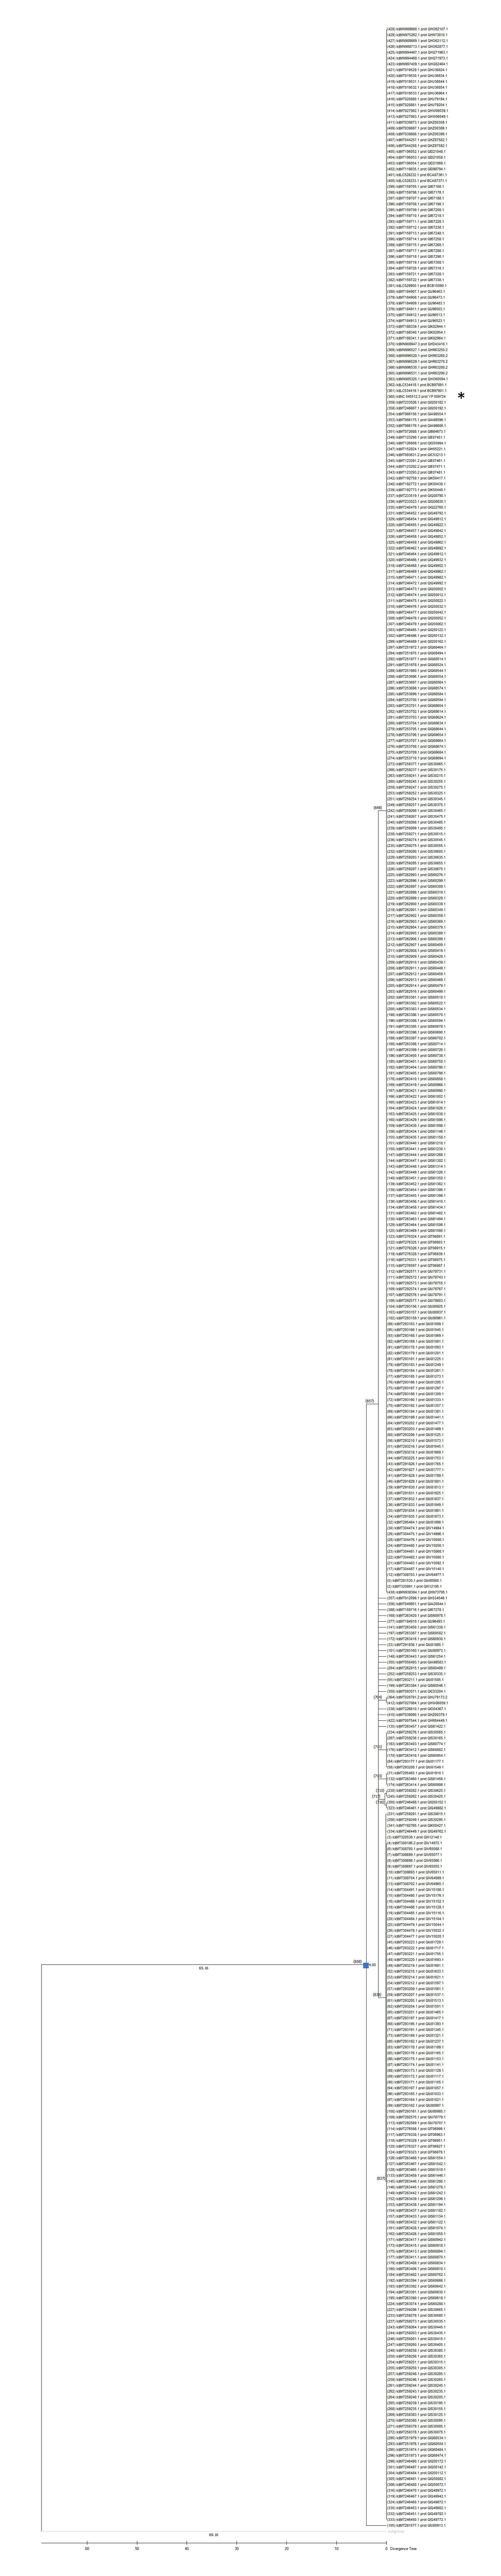
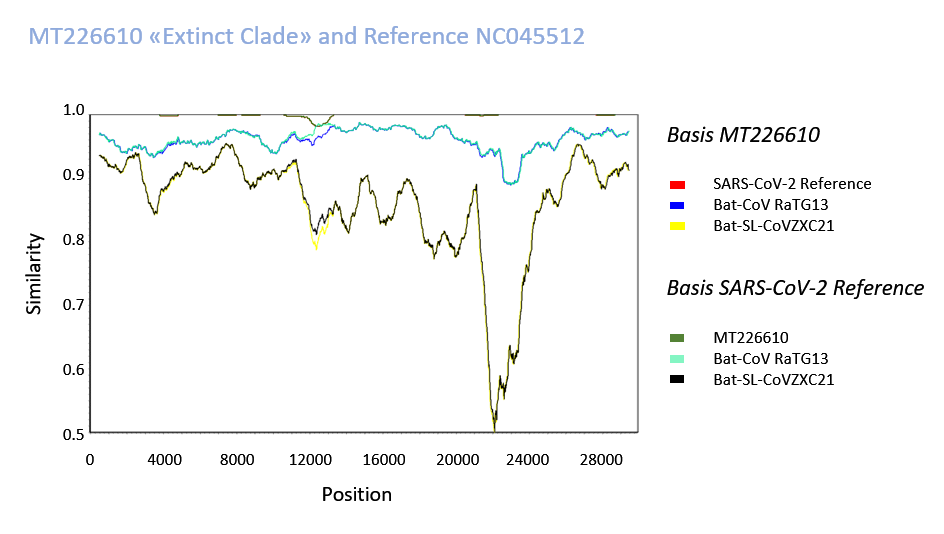
Figure 10: Phylogenetic tree of SARS-CoV-2 end of May 2020Phylogenetic trees were analysed with IQTREE. Sequences of SARS-CoV-2 were purified by several exclusion procedures with a cut-off for ambiguities and adaptor/primer containing sequence exclusion. The sequences represent all known open reading frames and analysis refers to the nucleotides 38-29834 of the reference sequence. Dating of the viral isolates (converted from Genbank format) in the phylogenetic analysis was carried through by the automated procedure. A Tamura-Nei +F +I model (empirical frequency, invariable sites) was used. The z-score cut-off for sequence inclusions is indicated, and removal of outliers in tree estimation leads to shortening of the common root from March 2018 to June/July 2019. The time of viral isolation is indicated by color in branches and tips of the sub-species. The nodes or respective roots are labelled by branch quality tests SH-aLRT (approximate likelihood ratio test) and the UFBoot value (bootstrap probability method). The histogram shows the distribution of the number of mutations accumulated in SARS-CoV-2 relative to NC045512. In the phylogenetic tree the reference sequence NC045512 is labelled with a red asterisk. The SimPlot demonstrates similarity of the found MT226610 (submission from Yunnan) sub-strain to the reference NC045512 as well as to bat-CoV RaTG13 and bat-SL-CoV ZXC21. Note the low similarity to the reference strain in region 12000 to 12800.
Phylogenetic trees were analysed with IQTREE. Sequences of SARS-CoV-2 were purified by several exclusion procedures with a cut-off for ambiguities and adaptor/primer containing sequence exclusion. The sequences represent all known open reading frames and analysis refers to the nucleotides 38-29834 of the reference sequence. Dating of the viral isolates (converted from Genbank format) in the phylogenetic analysis was carried through by the automated procedure. A Tamura-Nei +F +I model (empirical frequency, invariable sites) was used. The z-score cut-off for sequence inclusions is indicated, and removal of outliers in tree estimation leads to shortening of the common root from March 2018 to June/July 2019. The time of viral isolation is indicated by color in branches and tips of the sub-species. The nodes or respective roots are labelled by branch quality tests SH-aLRT (approximate likelihood ratio test) and the UFBoot value (bootstrap probability method). The histogram shows the distribution of the number of mutations accumulated in SARS-CoV-2 relative to NC045512. In the phylogenetic tree the reference sequence NC045512 is labelled with a red asterisk. The SimPlot demonstrates similarity of the found MT226610 (submission from Yunnan) sub-strain to the reference NC045512 as well as to bat-CoV RaTG13 and bat-SL-CoV ZXC21. Note the low similarity to the reference strain in region 12000 to 12800.
The tree searches were further completed by analysis of 4557 downloaded SARS-CoV-2 sequences. Quality criteria for inclusion of clinical or animal samples were a 4% cut-off of gap/ambiguity in nucleotide positions, a primer/adaptor exclusion and the omission of 5' 37 and 3' 69 nucleotides. The sequences with intra-individual polymorphisms were not evaluated and thus sequence MT372482 was further omitted. The few analysed animal sequences that were deposited in the current Genbank release were included such as SARS-CoV-2 from mink, tiger, cat and dog if selected in the previous step. MT226610 exceptionally showed a high mutation number of 28 nucleotides and was collected in January 2020 - the graph in Fig. 9 demonstrates an increasing number of mutations in the collection phase with further extremes of mutational changes but only one additional very rare sequence collected in March 2020, MT326179. This, however, occurs later in time and lacks overall sequencing quality with 553 undetermined nucleotides. The exceptional MT226610 "strain" is of high sequencing quality and would unlikely to have evolved from the reference NC045512. Molecular genetics of sequence comparisons does indicate large sequence differences to bat-CoV-RaTG13 or bat-SL-CoVZXC21. The most highly affected sequence stretch from nucleotides 12000-12800 deviates in 17 amino acids from the NC045512 reference (Fig. 10). Also these sequences may be graphed online with your internet browser, yet, may require a local sequence viewer installation on your computer (sequence download).
| nsp3 | nsp6 | nsp7 | nsp8 | nsp9 | nsp16 | S protein | ORF8 |
| 4288 E-D | 11083 L-F | 12041 D-H | 12160 E-D | 12773 A-S | 20980 D-H | 21784 N-K | 28144 L-S |
| 4307 K-Q | 11207 A-P | 12202 K-N | 12793 K-N | ||||
| 7479 N-S | 12208 K-N | 12355 Q-H | |||||
| 12378 R-K | |||||||
| 12464 A-S | |||||||
| 12467 A-S | |||||||
| 12491 D-Y | |||||||
| 12572 D-Y | |||||||
| 12578 D-Y | |||||||
| 12582 S-I | |||||||
| 12600 S-N | |||||||
| 12660 R-T | |||||||
| 12685 Q-H |
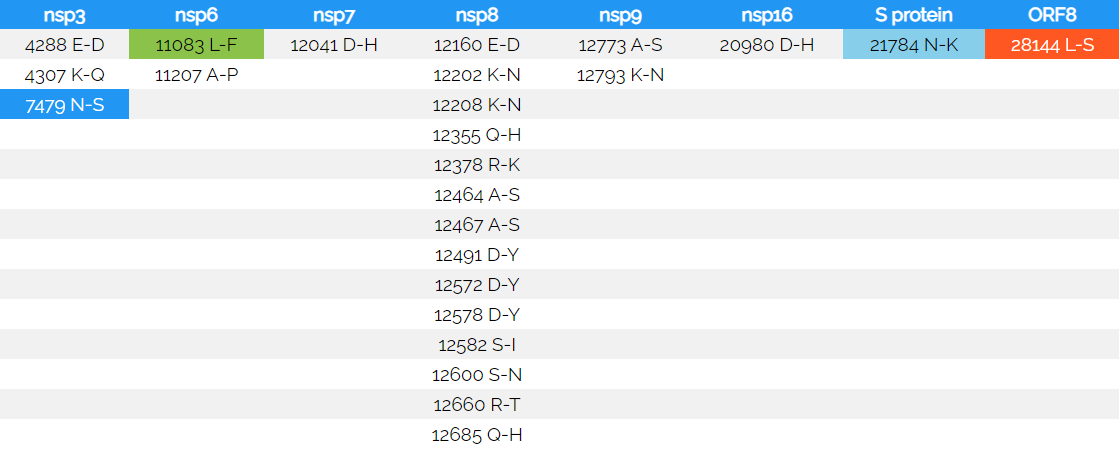
Table 4: Amino acid changes in the MT226610 sub-strainThe amino acid mutations are indicated in the open reading frames that have been described (nucleotide numbering of the NC045512 reference and MT226610), amino acid changes are indicated in single letter code (from - to). Silent mutations are found in the positions 8782, 11233, 12514 and in poly-A tail shortening in the mutant MT226610. The color corresponds to the 2 (light blue, S protein), 7 (blue, nsp3), 292 (green, nsp6) or 805 (orange, ORF8) select changes (certain sequence) that are detected in the set, once only occurring changes are non-colored. The silent changes are found 802-fold (8782), or once (11233, 12514). Proteinaceous changes are as well graphed in Fig. 15.
The amino acid mutations are indicated in the open reading frames that have been described (nucleotide numbering of the NC045512 reference and MT226610), amino acid changes are indicated in single letter code (from - to). Silent mutations are found in the positions 8782, 11233, 12514 and in poly-A tail shortening in the mutant MT226610. The color corresponds to the 2 (light blue, S protein), 7 (blue, nsp3), 292 (green, nsp6) or 805 (orange, ORF8) select changes (certain sequence) that are detected in the set, once only occurring changes are non-colored. The silent changes are found 802-fold (8782), or once (11233, 12514). Proteinaceous changes are as well graphed in Fig. 15.
The shows comparative analyses of the virus RNAs and demonstrates sequences alterations, reference NC045512 is more similar to RaTG13 and ZXC21 than the MT226610 isolate. The phylogenetic analysis would suggest that a sequence of events could be alluded to which involved a common ancestor of MT226610 and the NC045512 reference strain that dates back to March 2018, although sequence errors and negligence of submission could have affected the outcomes. Dating was introduced from collection dates indicated and adjusted for computing time by introducing the parameters obtained from optimization with the 200 sequence runs with IQTREE (Tamura-Nei +F +I). The z-score was chosen so that unobstructed tree formation was visualized (Fig. 10) and the time of the Most Recent Common Ancestor (MRCA) was estimated from internal dates; the estimate without sequence exclusion was 2018-03-23 [2017-01-13; 2019-01-24], z-score filtering resulted in 2019-06-10 [2019-01-15; 2019-10-19], 2019-06-25 [2019-01-20; 2019-10-19] and the most recent 2019-07-30 [2019-04-28; 2019-11-19] MRCA date. Interestingly, the MT226610 strain is of the S-type similar to RaTG13 or ZXC21 and therewith dissimilar to the proposed reference NC045512 (Fig. 8).
Supplementary Fig. 7: Sequences were compared with SimPlot with a Kimura 2-parameter model. Step 10 bp, GapStrip and a Window of 1000 was used to smoothen the graphical presentation. An accumulation of mutations in the sequence 12001-12800 with an approximately 24-fold excess may be speculated to have occurred by recombination, although this cannot be proven at this time. Alternatively, the prominence of mutations in this area could entail several genetic or protein-mediated mechanisms, one of which could involve (discussed in the text) the SARS-CoV-2 primase/processivity clamp (nsp7/8) interacting with the polymerase, and as a "mutator" may have affected evolution and viral genesis although a local increase of mutations is unexplained.
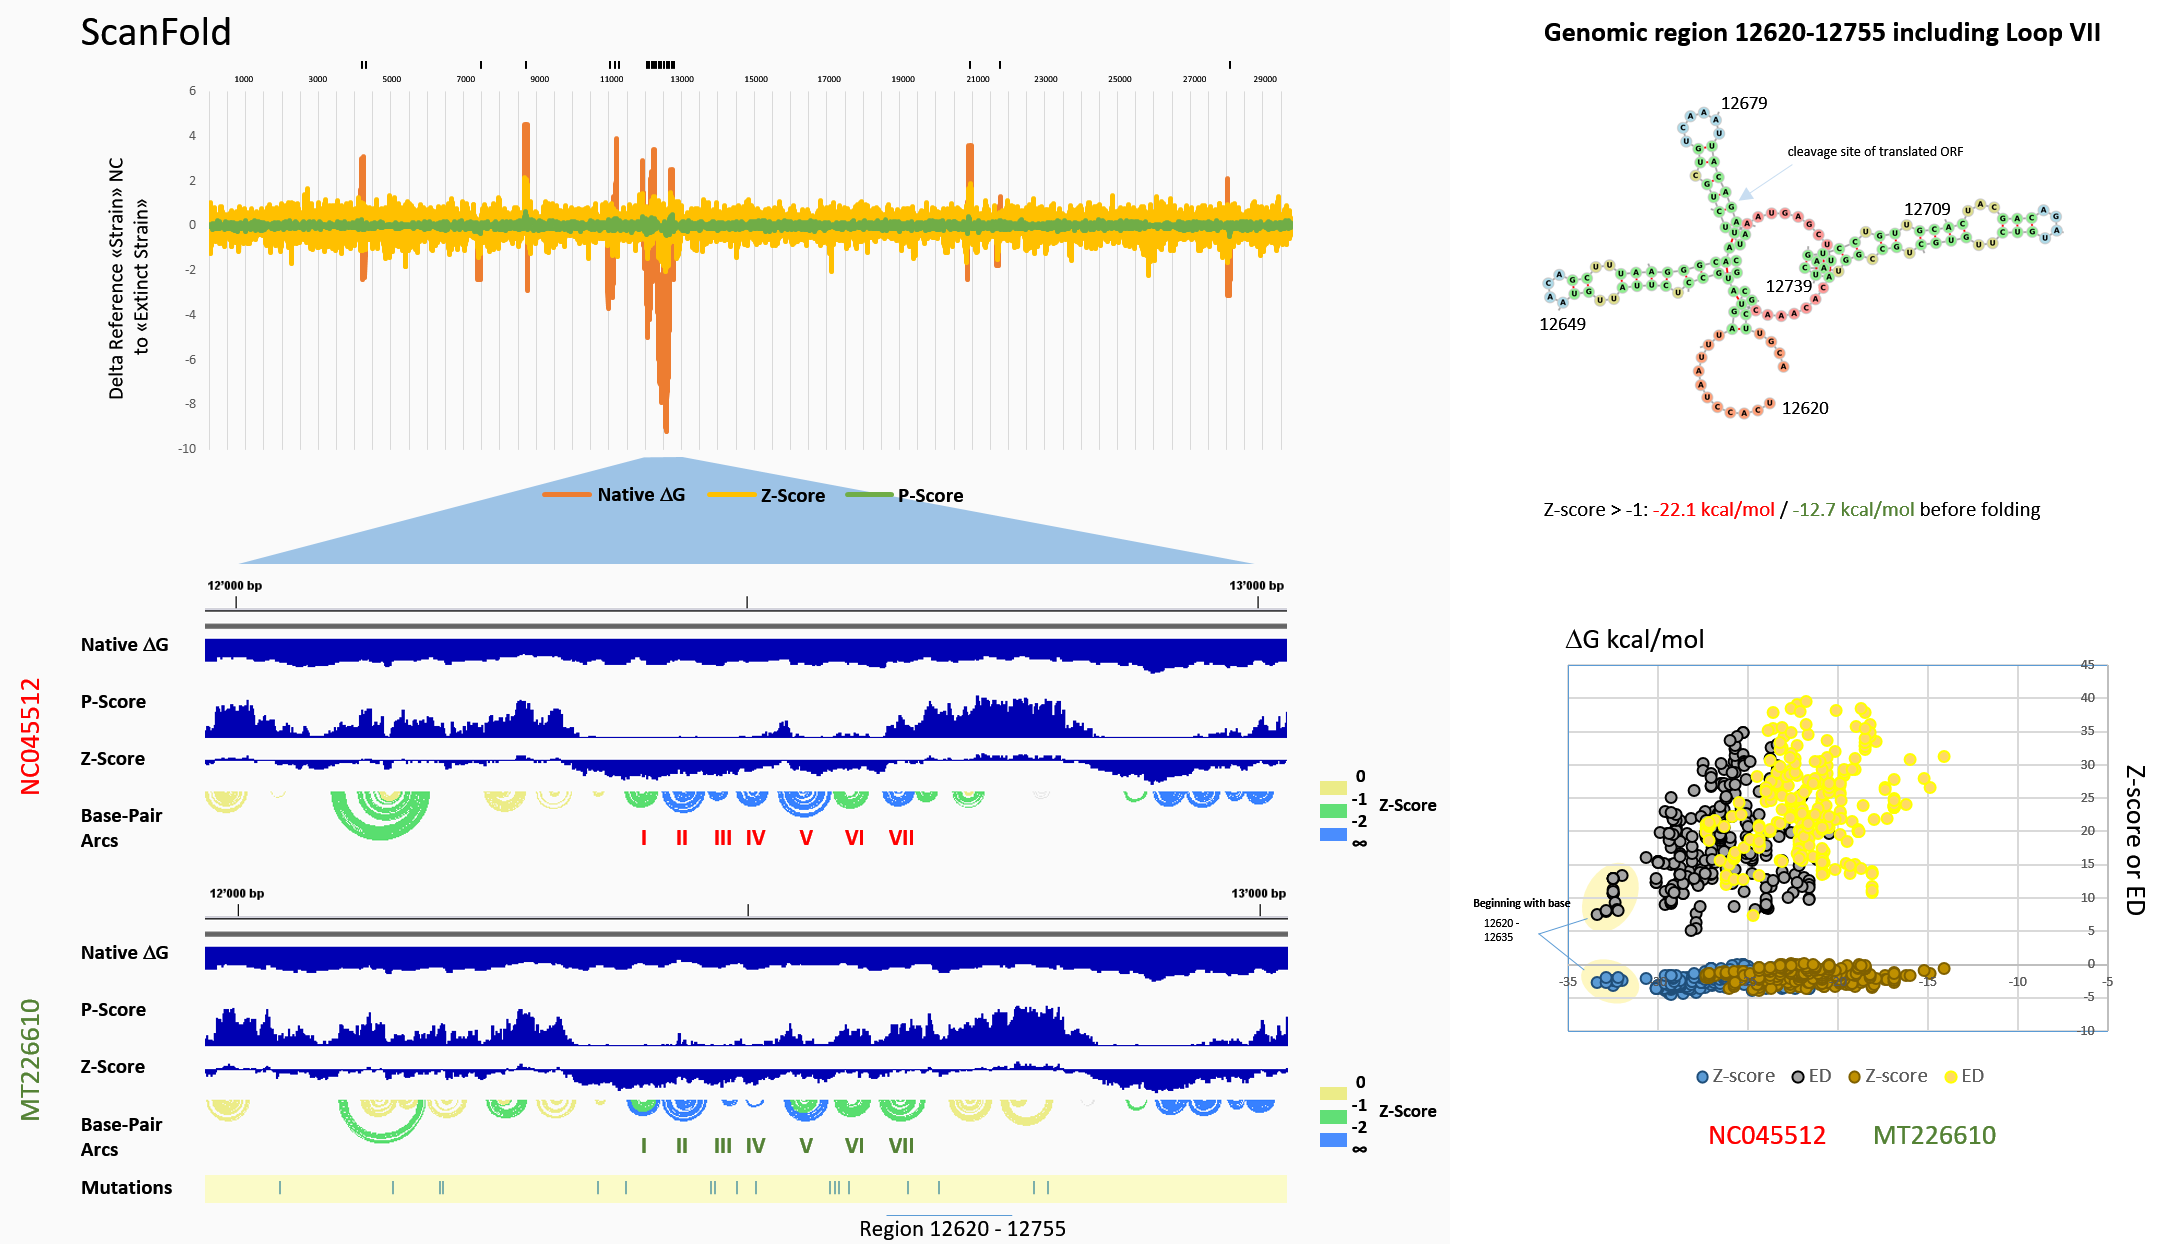
Figure 11: ScanFold: Stem-loops (SLs) in the genomic region 12000-13000 The genomic region was searched for SLs by ScanFold following a complete genomic analysis. The differences of scanning ΔGs (red), Z-scores (yellow) and P-scores (green) are graphed in the top line chart that includes the ScanFold output of region 12000-13000. The area is enlarged and is shown in the middle and bottom tracks. Base-pair arcs graphically picture the connections between base-pairs in the linear sequence which are exemplarily shown as SLs of the genomic sequence 12620-12755 to the right. These include the SLs scored with z-score ≤ -1. Genomic positions are indicated. To the left, arcs are labelled in yellow for 0 ≥ z > -1, green for -1 ≥ z > -2 and blue for z-score ≤ -2. The track of mutations in the Yunnan (MT226610) strain is shown below for analysis. The summary of data for the 12381-12670 region is graphed with Z-scores, Ensemble Diversity (ED) versus ΔG.
The genomic region was searched for SLs by ScanFold following a complete genomic analysis. The differences of scanning ΔGs (red), Z-scores (yellow) and P-scores (green) are graphed in the top line chart that includes the ScanFold output of region 12000-13000. The area is enlarged and is shown in the middle and bottom tracks. Base-pair arcs graphically picture the connections between base-pairs in the linear sequence which are exemplarily shown as SLs of the genomic sequence 12620-12755 to the right. These include the SLs scored with z-score ≤ -1. Genomic positions are indicated. To the left, arcs are labelled in yellow for 0 ≥ z > -1, green for -1 ≥ z > -2 and blue for z-score ≤ -2. The track of mutations in the Yunnan (MT226610) strain is shown below for analysis. The summary of data for the 12381-12670 region is graphed with Z-scores, Ensemble Diversity (ED) versus ΔG.
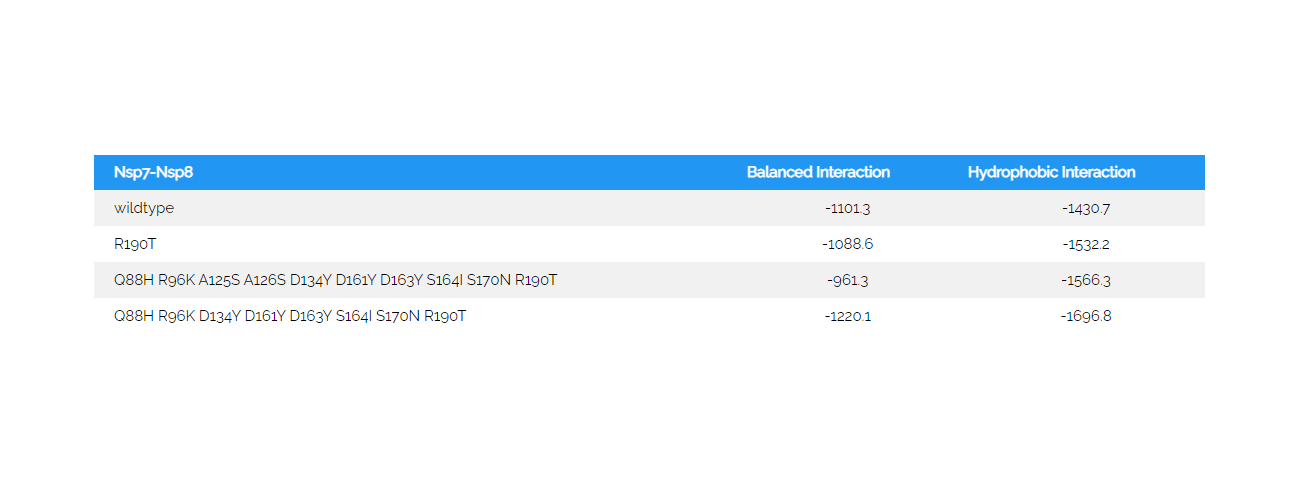
In a further experimental test, I investigated, whether the SARS-CoV-2 changes found in MT226610 were related to RNA alterations (protein changes in the mutant are listed, Table 4). The protein changes and related functional alterations will require more studies, are summarised for nsp7-nsp8 of the RNA polymerase complex and will be reported later (Table 5). Here, the protein ClusPro docking results show, that the wildtype NC045512 nsp8 loses some interaction affinity when only Arg190 was exchanged with Thr and the hydrophobic interaction was increased (nsp7 remained in wildtype form). When Gln88His, Arg96Lys, Ala125Ser, Ala126Ser, Asp134Tyr, Asp161Tyr, Asp163Tyr, Ser164Ile, Ser170Asn, Arg190Thr were exchanged as in MT226610 it is observed that ClusPro results in a 12.7% decreased interaction energy whereas hydrophobic interaction was increased; here nsp7 included the Asp67His exchange. It is observed, that if Ala125 and Ala126 were not changed to Ser, the energy of interaction is increased by 10.8% even further increasing the hydrophobic interaction term. Also here the nsp7 Asp67 was changed to His. The results could suggest, that an interplay of single mutations that occurred which may have decreased the affinity of nsp8 and nsp7, may have been rescued by subsequent changes and could finally lead to loss of high affinity assembly of nsp7-nsp8 and with nsp12.
The ScanFold scanning of MT226610 in comparison to NC045512 resulted in an interesting output that included aligned, newly generated and even vanished RNA folds in the 12000-13000 genomic region. In particular, changes at the z-score ≤ -2 were evident in the genomic 12381-12670 sequence. A summary of the results of the ScanFold differences with a focus on the 12000-13000 is shown in Fig. 11. Mutations are labelled in the bottom track, the line chart shows the differences of ΔGs, z-scores and p-scores that resulted from window scanning the RNA sequences with ScanFold. When visualizing predicted folds of the RNA stems that were found, this showed that SL III has shortened and slightly shifted in MT226610, number IV may form but has two more unpaired residues, number V may form but has lost its free energy of folding. Number II is equally forming, yet, loses free energy although not mutated itself. SL I is safely forming only in the mutant MT226610. VI and VII lose free energy and may form more often in the non-mutant reference NC045512.
| Nsp7-Nsp8 | Balanced Interaction | Hydrophobic Interaction |
| wildtype | -1101.3 | -1430.7 |
| R190T | -1088.6 | -1532.2 |
| Q88H R96K A125S A126S D134Y D161Y D163Y S164I S170N R190T | -961.3 | -1566.3 |
| Q88H R96K D134Y D161Y D163Y S164I S170N R190T | -1220.1 | -1696.8 |
Table 5: ClusPro docking on mutant and wildtype nsp7-nsp8Cluspro was used to analyse the mutant changes in the putatively "extinct" strain MT226610 (6yyt structures). The SARS-CoV-2 viral amino acid replacements found in comparison to the NC045512 strain were introduced. Nsp8 chain 84 to 191 and nsp7 residues 1 to 73 were used, i.e. the N-terminal extension of nsp8 was not included. Mutants corresponded to the Arg190Thr (nsp8) or the full and a partial set of amino acid replacements Gln88His, Arg96Lys, Ala125Ser, Ala126Ser, Asp134Tyr, Asp161Tyr, Asp163Tyr, Ser164Ile, Ser170Asn, Arg190Thr and Gln88His, Arg96Lys, Asp134Tyr, Asp161Tyr, Asp163Tyr, Ser164Ile, Ser170Asn, Arg190Thr, respectively. Nsp7 included the here found MT226610 Asp67His exchange with the latter two mutants.
Cluspro was used to analyse the mutant changes in the putatively "extinct" strain MT226610 (6yyt structures). The SARS-CoV-2 viral amino acid replacements found in comparison to the NC045512 strain were introduced. Nsp8 chain 84 to 191 and nsp7 residues 1 to 73 were used, i.e. the N-terminal extension of nsp8 was not included. Mutants corresponded to the Arg190Thr (nsp8) or the full and a partial set of amino acid replacements Gln88His, Arg96Lys, Ala125Ser, Ala126Ser, Asp134Tyr, Asp161Tyr, Asp163Tyr, Ser164Ile, Ser170Asn, Arg190Thr and Gln88His, Arg96Lys, Asp134Tyr, Asp161Tyr, Asp163Tyr, Ser164Ile, Ser170Asn, Arg190Thr, respectively. Nsp7 included the here found MT226610 Asp67His exchange with the latter two mutants.
When independent evaluation of RNA structure energies showed that there were gross differences in predicted SLs (z-score ≤ -2) of -39.7 kcal/mol, the RNA fold of residues 12381-12670 was further tested by folding including all residues z > -2. Then, the overall differences reduced to -14.3 kcal/mol in the fold of NC045512 relative to the mutant, suggesting that not only loops III and IV had contributed to the overall folding energy (not shown, see Fig. 11). Genomic regions of the 5'- and 3'-UTR (untranslated region) have been previously shown to form structured RNA and were analysed by ScanFold (40). This procedure had also predicted the structure of the frame-shift element (FSE) that is adjacent to the genomic 12381-12670 area and found in residues 13428-13542. The coronaviridae do show a diversity of packaging signals that have previously been reviewed for RNA folds (41). The RNA elements described here could thus "in-trans" affect the FSE or may otherwise form a packaging signal.
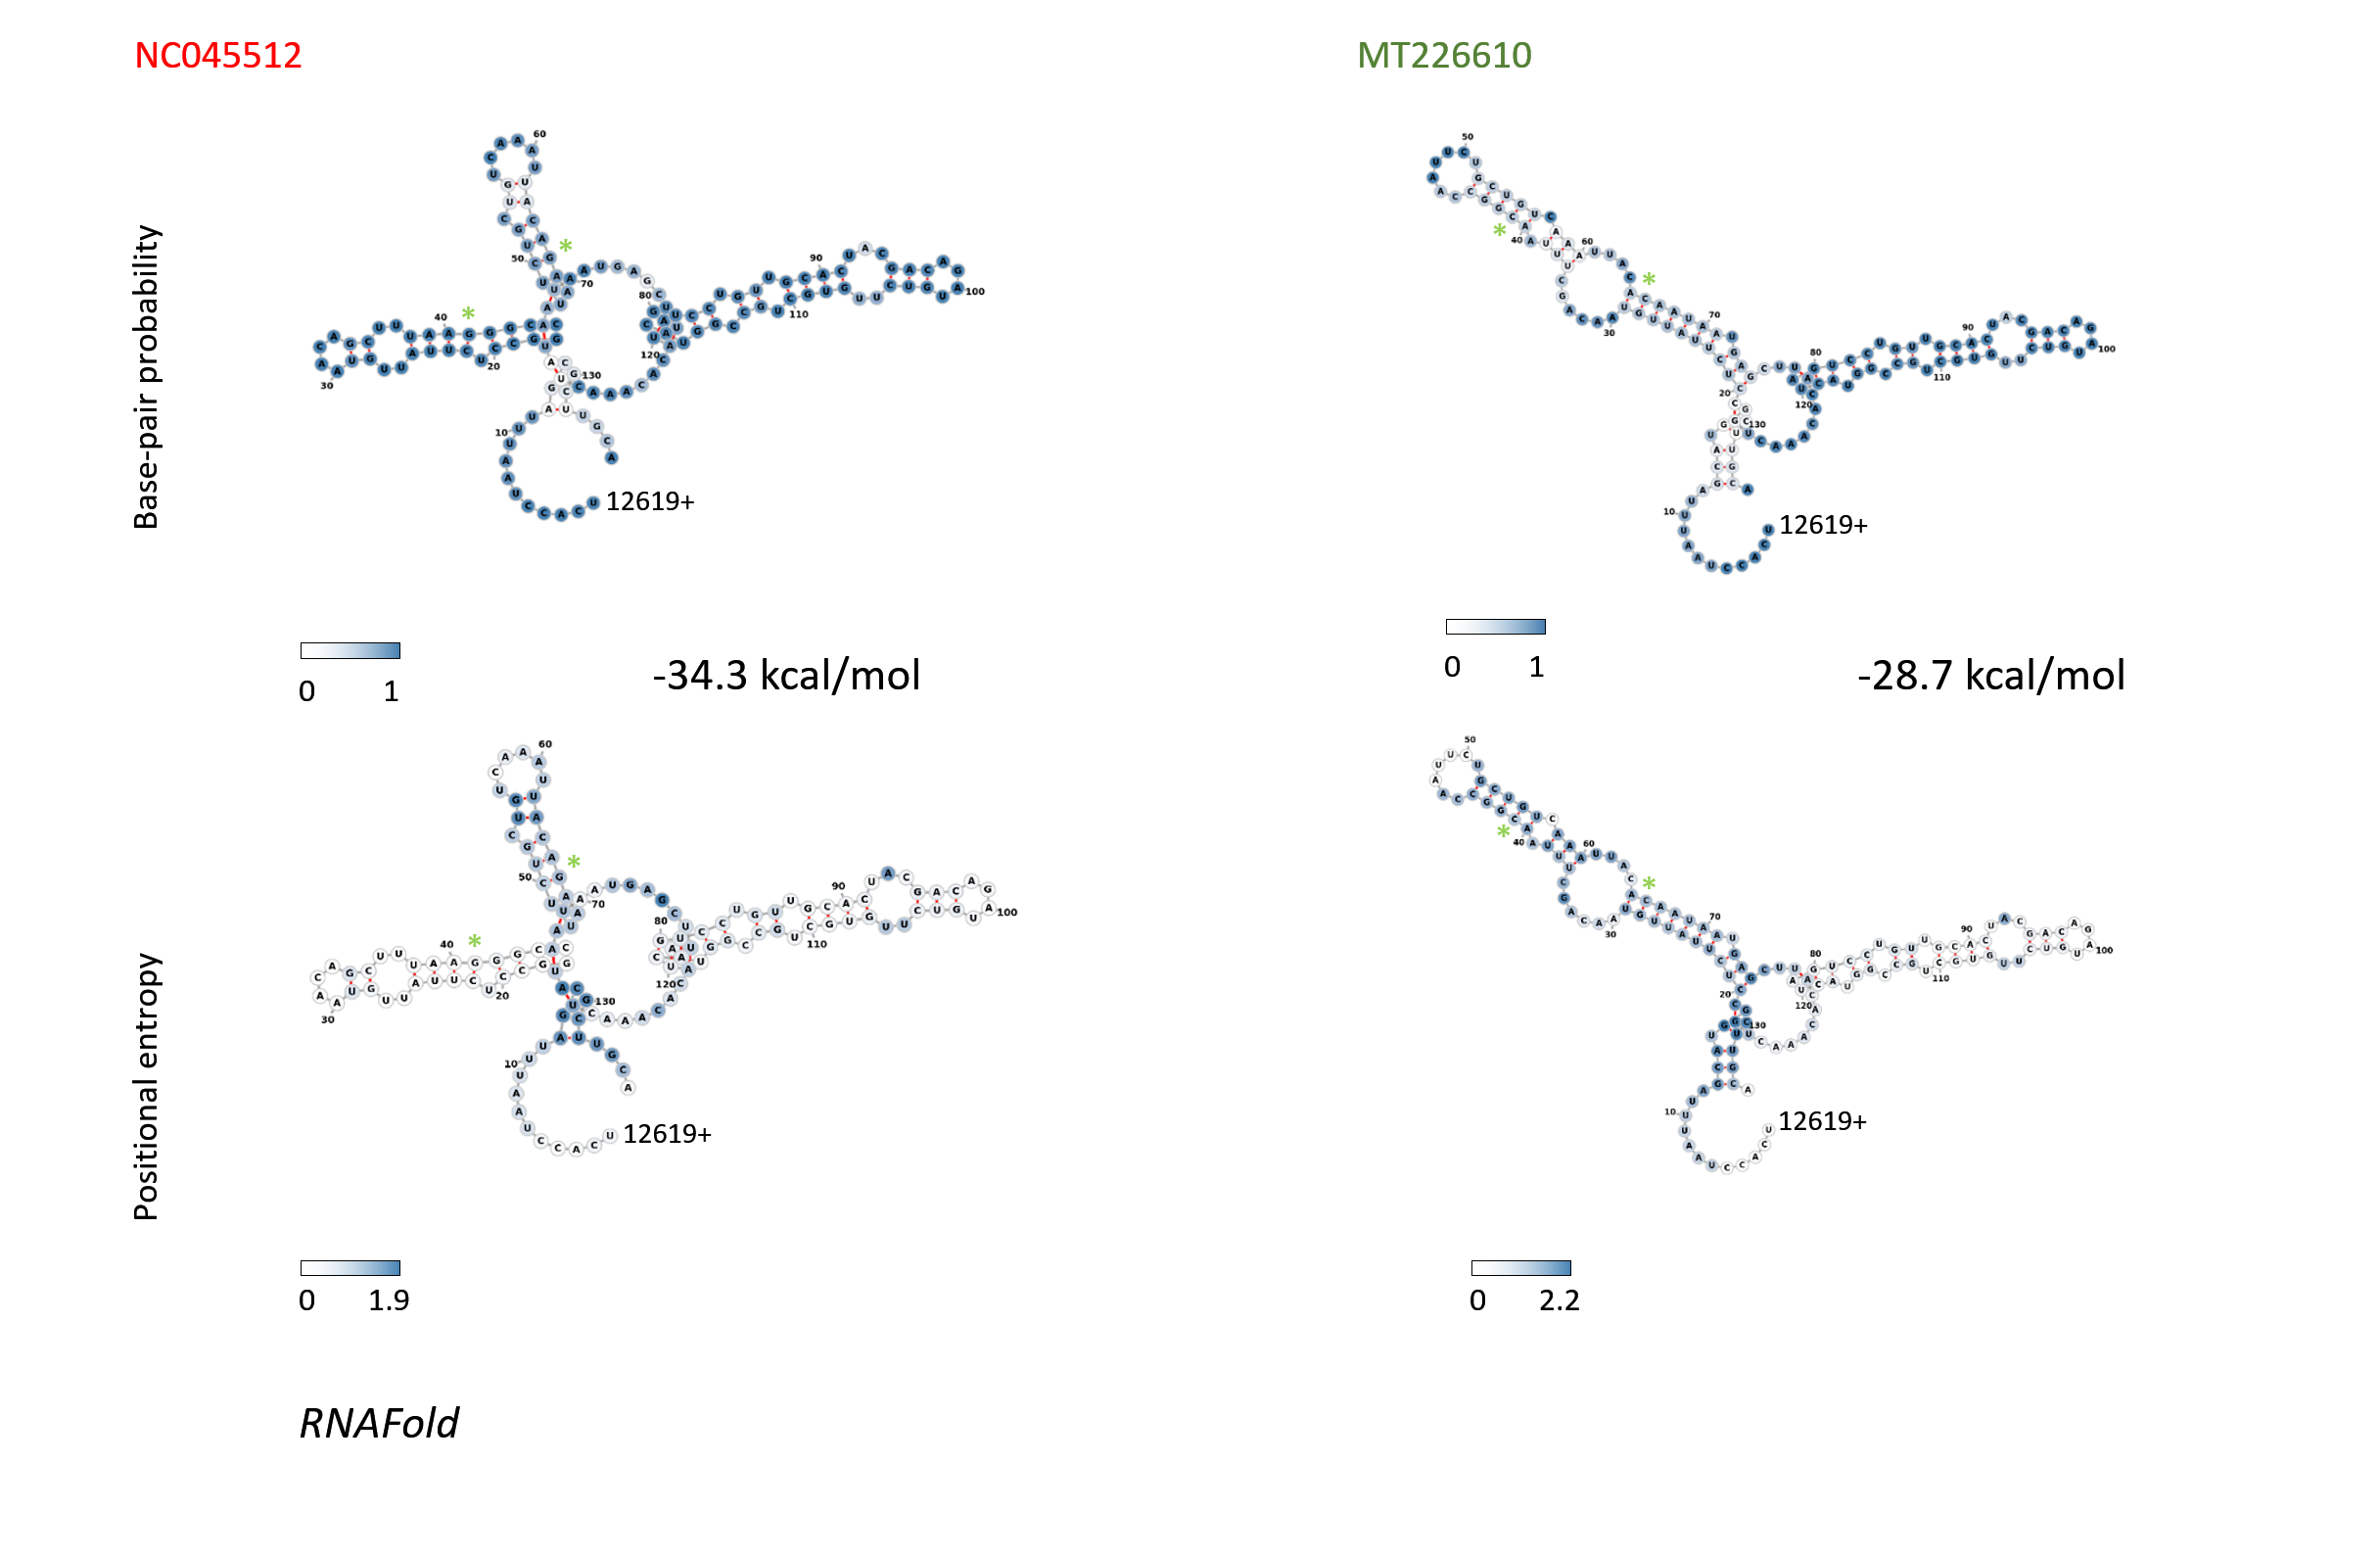
Figure 12: Structure and folding of the SARS-CoV-2 genomic region 12620-12755 with 136 bases RNAfold was used to predict the structure of region 12620-12755. Base pair probabilities are graphed in the top row, the bottom pictures show the positional entropies of the corresponding structures of SARS-CoV-2 strain NC045512 and the MT226610 sub-strain.
RNAfold was used to predict the structure of region 12620-12755. Base pair probabilities are graphed in the top row, the bottom pictures show the positional entropies of the corresponding structures of SARS-CoV-2 strain NC045512 and the MT226610 sub-strain.
When further qualitatively scrutinizing bases 4152-4442, 7334-7623, 8637-8923, 11029-11318, 11982-12271, 12272-12561, 12562-12852, 20835-21124, 21639-21928 and 27999-28288 for stuctural energies of the MT226610 mutational regions (window 120), primarily the elements in regions 11982-12271, 12272-12561, 12562-12852 displayed a loss of good folded structures. The fully extended window, as judged by energies, would have included residues 12620-12755 and was graphed as structure in Fig. 11 (top right). The differentially missing population of high scoring structures in the scanning analysis is shown in Fig. 11 for bases 12381-12670 which was then chosen to observe the changes in structures 3' from loop VII. The base-pair probabilities of these bases in particular (12620-12755) and their positional entropies are graphed in Fig. 12. These base pairs show entropies from 0-1.9 for the NC045512 reference and 0-2.2 for MT226610. The fold energies for the former strain correspond to -34.3 kcal/mol whereas the latter sub-strain shows a value of -28.7 kcal/mol.
| nsp2 | nsp3 | nsp8 | nsp12 | S protein | ORF3a | M |
| 1059 T-I | 2952 D-G | 12139 F-L | 13513/4 G-Y | 23403 D-G | 25563 Q-H | 26739/0 I-A |
| 2956 L-F | 14408 P-L | |||||
| 2957 D-Y |
Table 6: Amino acid changes in the MT326179 sub-strainThe amino acid mutations are indicated in the open reading frames that have been described (nucleotide numbering of the NC045512 reference), amino acid changes are indicated in single letter code (from - to). Silent mutations are found in the positions 226 AG (1), 227 GC (1), 232Del (1), 234 TA (1), 235 AG (2), 236 GA (2), 237 GT (2), 241 CT (2415), 2752 TC (1), 3037 CT (2446), 12133 TA (1), 12136 TA (1), 13512 AT (6), 14769 TG (1), 23473 TC (1), 25096 CG (1), 26738 AG (1), 29553 GA (223) (number of changes in the entire sequence set are shown in parenthesis) and in one further exchange proximal to the poly-A tail in the mutant MT326179. The last 29553 exchange follows a stop codon in the N protein. It is not found in ORF10. The color corresponds to the 2,3,5,6 (light blue, nsp3 or nsp12), 1438 (blue, nsp2), 1709 (green, ORF3a), 2461 (orange, nsp12) or 2470 (red, S protein) select changes (certain sequence) that are detected in the set, once only occurring changes are non-colored. Changes of the 5' UTR are shown in Fig. 9.
he amino acid mutations are indicated in the open reading frames that have been described (nucleotide numbering of the NC045512 reference), amino acid changes are indicated in single letter code (from - to). Silent mutations are found in the positions 226 AG (1), 227 GC (1), 232Del (1), 234 TA (1), 235 AG (2), 236 GA (2), 237 GT (2), 241 CT (2415), 2752 TC (1), 3037 CT (2446), 12133 TA (1), 12136 TA (1), 13512 AT (6), 14769 TG (1), 23473 TC (1), 25096 CG (1), 26738 AG (1), 29553 GA (223) (number of changes in the entire sequence set are shown in parenthesis) and in one further exchange proximal to the poly-A tail in the mutant MT326179. The last 29553 exchange follows a stop codon in the N protein. It is not found in ORF10. The color corresponds to the 2,3,5,6 (light blue, nsp3 or nsp12), 1438 (blue, nsp2), 1709 (green, ORF3a), 2461 (orange, nsp12) or 2470 (red, S protein) select changes (certain sequence) that are detected in the set, once only occurring changes are non-colored. Changes of the 5' UTR are shown in Fig. 9.
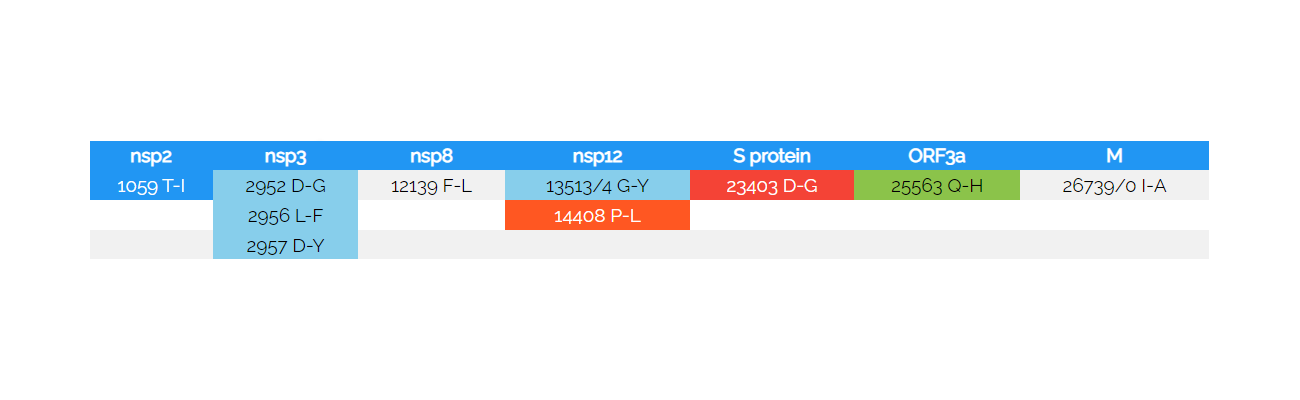
The seminal analysis of the MT326179 sub-strain demonstrating an elevated mutation count, yet later than the first discussed MT226610 "strain", shows the accumulating mutations within the 5' UTR (8 changes, positions 226-241). Interestingly, these mutations (Fig. 9) localise to the SL5b which is adjacent to the SLs 5a and c and the translational START signal (sequence position 182-268). The energy determined by RNAfold resulted in a fold energy of -41.4 kcal/mol for the reference sub-strain and the MT326179 mutant scored a -38.5 kcal/mol. This suggests, that the necessary stem-loop SL5b may form less often or with an altered secondary structure that may translate into an altered tertiary fold. Altogether, the following positions show exchanges: 226 AG (1), 227 GC (1), 232Del (1), 234 TA (1), 235 AG (2), 236 GA (2), 237 GT (2), 241 CT (2415), 1059 CT (1438), 2752 TC (1), 2952 AG (3), 2956 AT (2), 2957 GT (2), 3037 CT (2446), 12133 TA (1), 12136 TA (1), 12139 TA (1), 13512 AT (6), 13513 GT (6), 13514 GA (5), 14408 CT (2461), 14769 TG (1), 23403 AG (2470), 23473 TC (1), 25096 CG (1), 25563 GT (1709), 26738 AG (1), 26739 AG (1), 26740 TC (1), 29553 GA (223) (number of changes in the entire sequence set are shown in parenthesis). Non-synonymous changes are listed in Table 6.
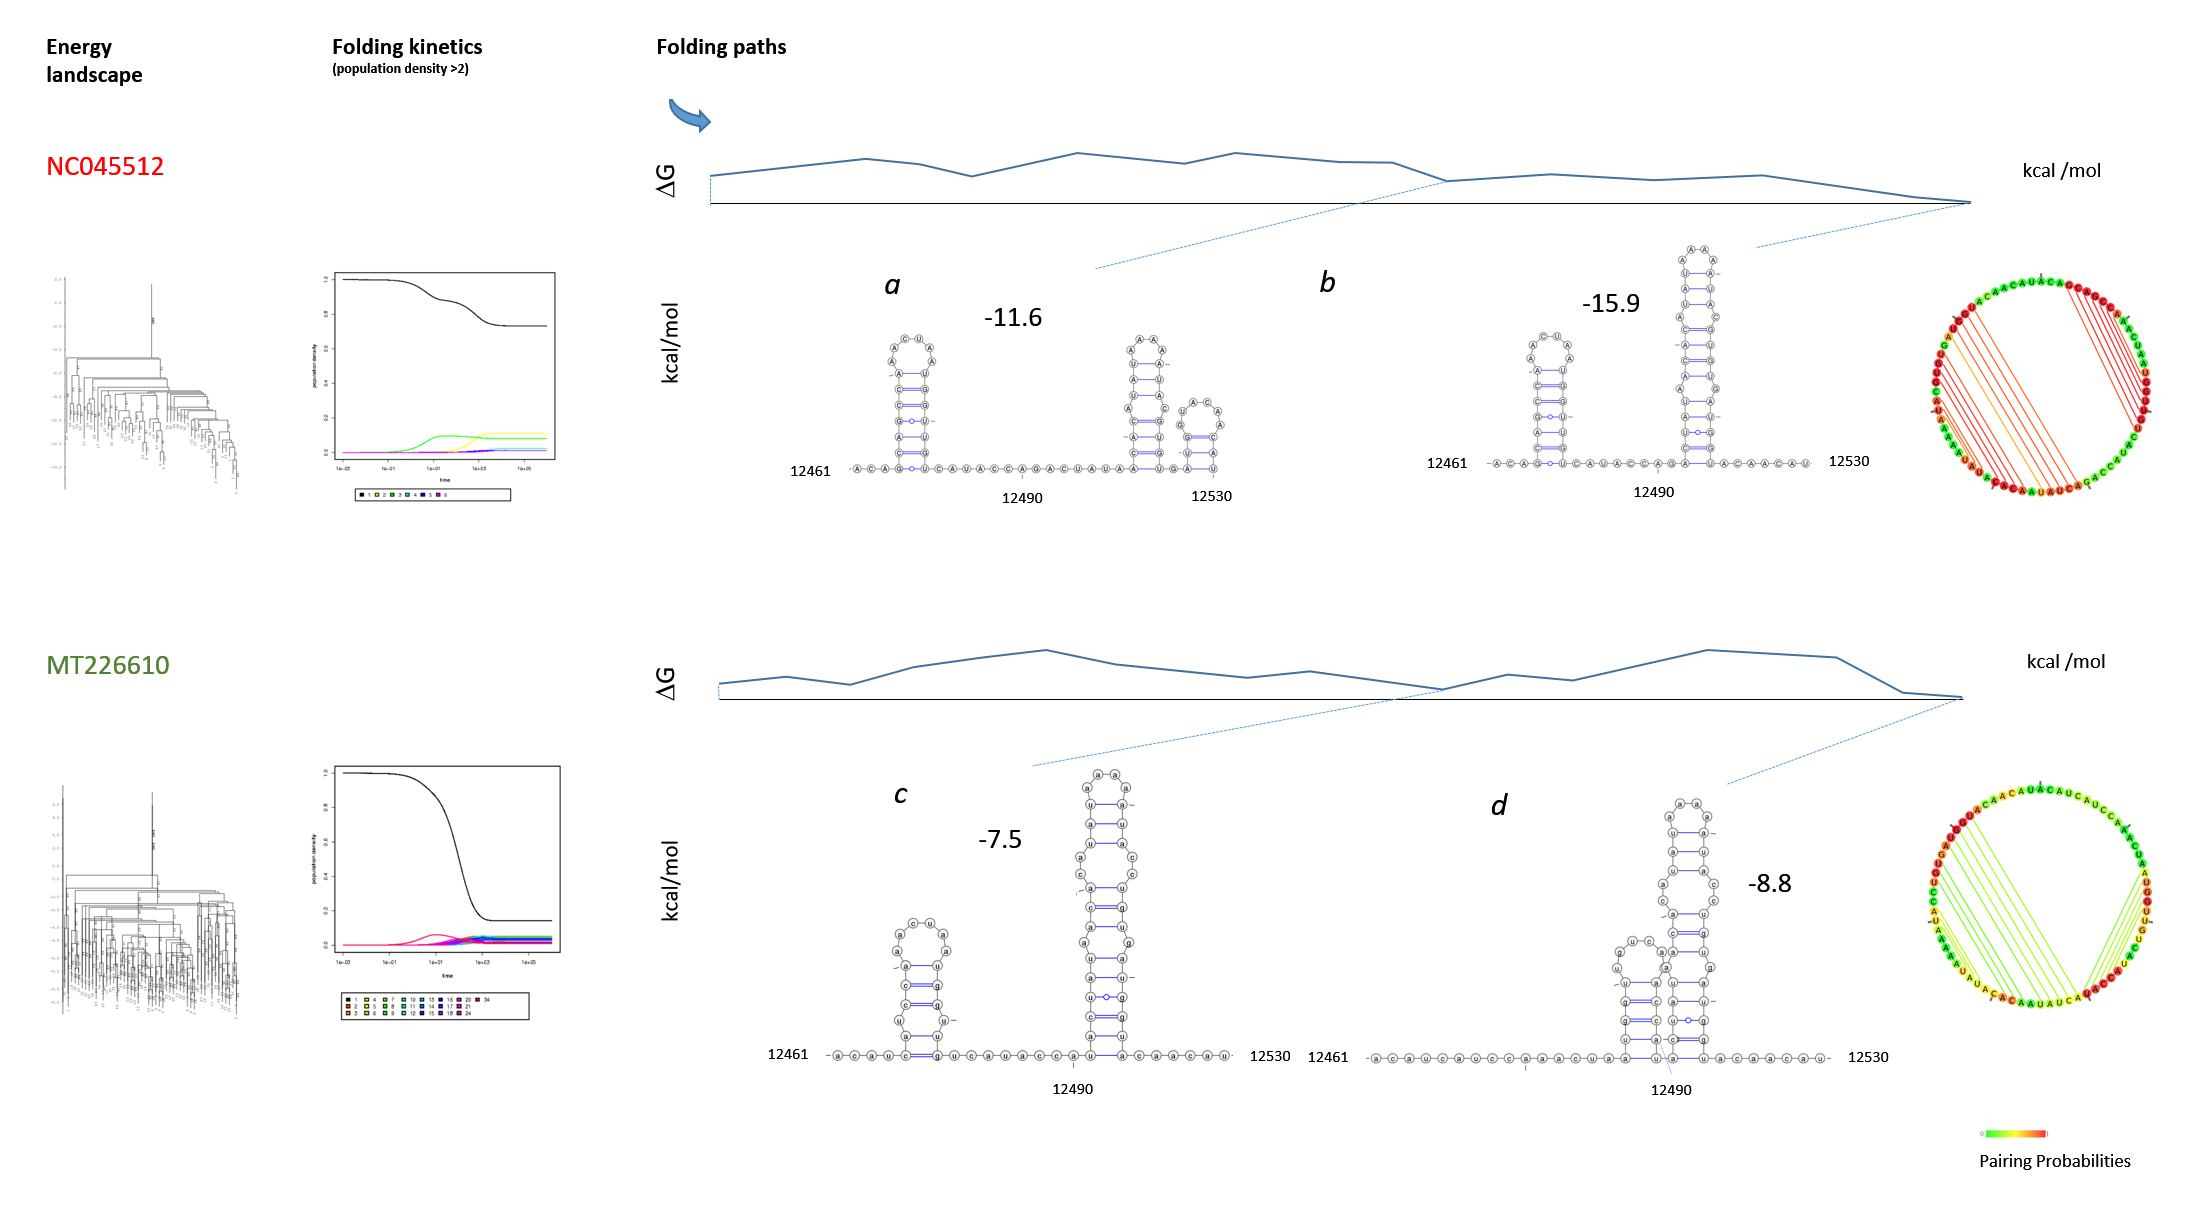
Figure 13: Structure and folding of the SARS-CoV-2 genomic region 12461-12530 The SARS-CoV-2 strain NC045512 (Wuhan) was compared with the MT226610 strain (Yunnan). The SLs III and IV (Fig. 11) are graphed from genomic region 12461-12530. The folding paths were analysed with "barriers" at rna.tbi.univie.ac.at. The web environment provided the output that is graphed with Varna to compare wildtype (a, b) with the mutant (c, d) and to confirm the results of the ScanFold analysis. The graphs of the RNA folding landscape, folding kinetics and initial structure (circular base connectome) are included. The folding paths free energies are indicated (kcal/mol). Further energy calculations show a ΔG = -58.9 kcal/mol for the unfolded structure 12381-12670 (SLs I-VII) containing the highly scoring SLs alone for NC045512, but a ΔG = -19.2 kcal/mol for the highly scoring SLs of MT226610. Whereas after refolding by RNAstructure the ΔG of NC045512 is increased to -81.8 kcal/mol, the MT226610 ΔG shows the increase to -67.5 kcal/mol, that is clearly different overall from the NC045512 wildtype.
The SARS-CoV-2 strain NC045512 (Wuhan) was compared with the MT226610 strain (Yunnan). The SLs III and IV (Fig. 11) are graphed from genomic region 12461-12530. The folding paths were analysed with "barriers" at rna.tbi.univie.ac.at. The web environment provided the output that is graphed with Varna to compare wildtype (a, b) with the mutant (c, d) and to confirm the results of the ScanFold analysis. The graphs of the RNA folding landscape, folding kinetics and initial structure (circular base connectome) are included. The folding paths free energies are indicated (kcal/mol). Further energy calculations show a ΔG = -58.9 kcal/mol for the unfolded structure 12381-12670 (SLs I-VII) containing the highly scoring SLs alone for NC045512, but a ΔG = -19.2 kcal/mol for the highly scoring SLs of MT226610. Whereas after refolding by RNAstructure the ΔG of NC045512 is increased to -81.8 kcal/mol, the MT226610 ΔG shows the increase to -67.5 kcal/mol, that is clearly different overall from the NC045512 wildtype.
A recent preprint (42) had discussed the analysis of RNA structures conserved in SARS-CoV-2 and has pointed towards a window element from bases 12610-12729 as one of several conserved SARS-CoV-2 structured regions (p=0.978, z=-1.94) - this had serendipitously been scrutinized further here and thus is confirmed to form trifoil structures in extended positions 12620-12755. To further confirm and test the ScanFold procedure, it is added that direct analysis of RNA folding paths suggests, that the MT226610 mutant would, for example, form close to identical shapes of adjacent SLs (see III and IV) (Fig. 13, c) than the wildtype (Fig. 13, b), yet, would attain only the ΔG = -7.5 kcal/mol versus ΔG = -15.9 kcal/mol. Overall, the final folds of conformers 12461-12530 found in the in silico experiment differ and attain ΔG = -15.9 kcal/mol in NC045512 (b) and reach the ΔG = -8.8 kcal/mol in the MT226610 RNA (d). When testing the same method for SLs V and VI (Fig. 14), it can be further confirmed, that the folding path and final conformers are consistent with the ScanFold results and show loops V and VI close to each other in the wildtype NC045512 strain at more favourable energy (a, b) and slightly separated in MT226610 (c, d).
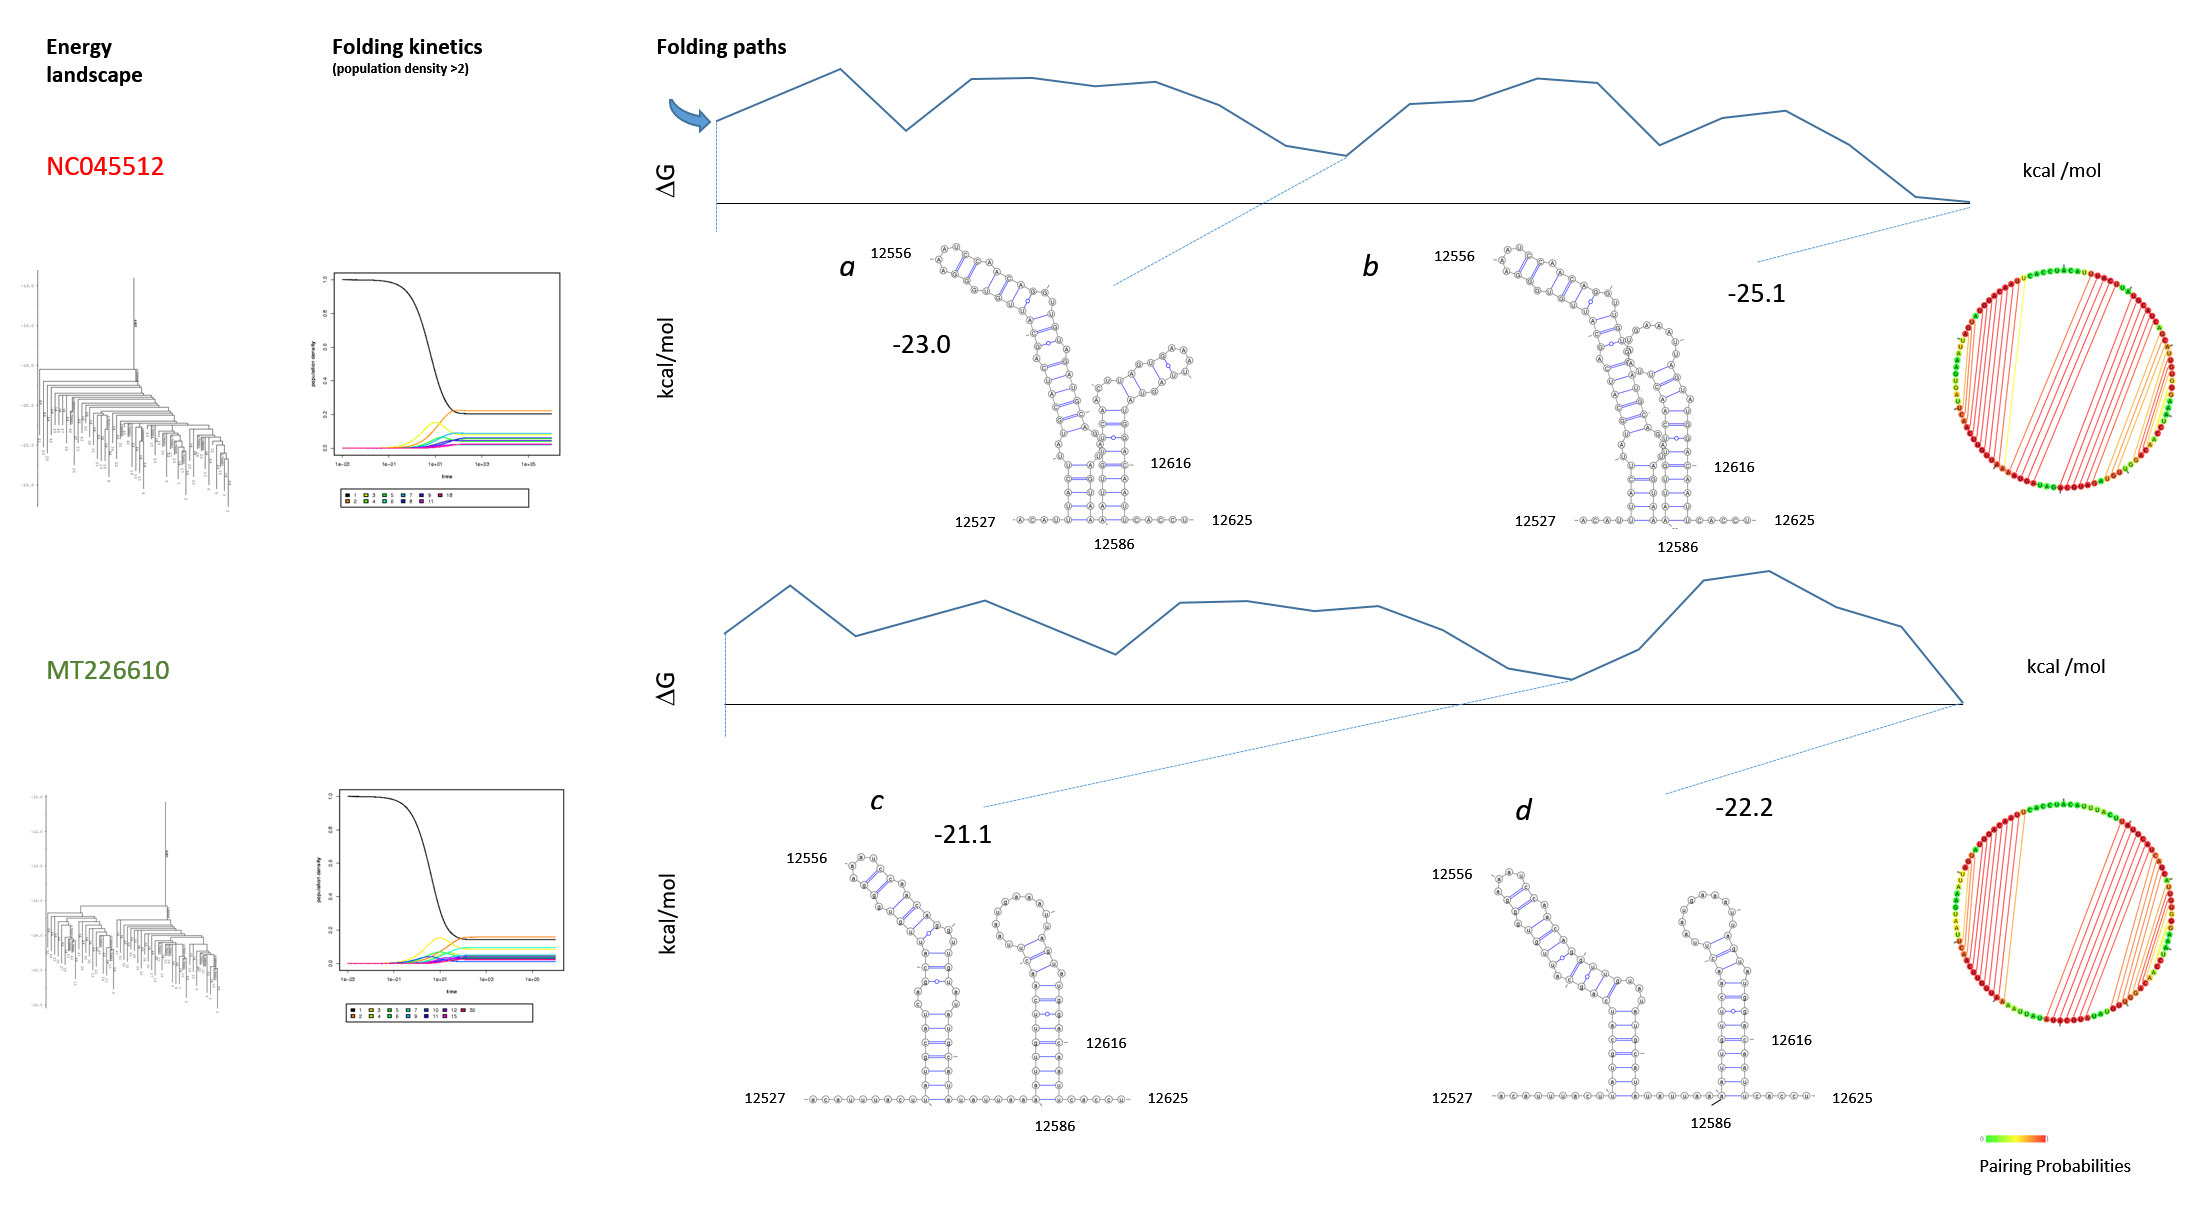
Figure 14: Structure and folding of the SARS-CoV-2 genomic region 12527-12625 The SARS-CoV-2 strain NC045512 (Wuhan) was compared with the MT226610 strain (Yunnan). The SLs V and VI (Fig. 11) are graphed from genomic region 12527-12625. The folding paths were analysed with "barriers" at rna.tbi.univie.ac.at. The web environment provided the output that is graphed with Varna to compare wildtype (a, b) with the mutant (c, d). The graphs of the RNA folding landscape, folding kinetics and initial structure (circular base connectome) are included. The folding paths free energies are indicated (kcal/mol).
The SARS-CoV-2 strain NC045512 (Wuhan) was compared with the MT226610 strain (Yunnan). The SLs V and VI (Fig. 11) are graphed from genomic region 12527-12625. The folding paths were analysed with "barriers" at rna.tbi.univie.ac.at. The web environment provided the output that is graphed with Varna to compare wildtype (a, b) with the mutant (c, d). The graphs of the RNA folding landscape, folding kinetics and initial structure (circular base connectome) are included. The folding paths free energies are indicated (kcal/mol).
Discussion
Current evidence for the mutant MT226610 would suggest, that affected proteins could play a role in diminishing the replication rate, and likely transmission of the sub-strain. The polymerase protein nsp12 is itself not altered by mutations, yet, the associated proteins nsp7 and nsp8 are affected. The recently obtained nsp7-nsp8-nsp12 structures indicate that the processivity of the nsp12 enzyme may be detrimentally lowered by exchange of residues that are proposed to contact the RNA exiting from the polymerase tunnel (43, 44). Whether the gross changes at the surface of nsp8 (Fig. 15) would contribute to the compensatory interactions, that are decreased in mutant form, or are even increased to further maintain replication at a high, and mutations at a low rate, remains open to further investigations. So far, it could be proposed, that inter-molecular interactions of nsp7-nsp8 and nsp12 in switching or assembling the tetrameric polymerase, hexadecameric primase and then decameric form of the active enzyme would be affected by surface alterations and could affect directional interactions of nsp7 and nsp8. Previous analysis of SARS-CoV-1 and the biochemical activity that was determined for the polymerase complex (45), show that exchange of Arg190 with Ala in nsp8 strongly decreased primer extension and interaction of the subunit with the polymerase nsp12. Interaction of this enzyme with nsp12 can now be structurally explained by the likely requirement of the residue Arg190 in interaction with nsp7 (see Table 5, Fig. 15); the salt bridge formed would be 6 Å-7 Å in length (nsp8 Arg - nsp7 Glu). Yet, for SARS-CoV-2 mutant MT226610 it can be shown (Table 5), that a similar alteration, here the mutation of Arg190 to Thr in nsp8 led to little change (-1.2%) in energy of interaction that may have caused and triggered the cascade of changes that could have finally abolished the high affinity of interaction with nsp7. Thus, mutations of the MT226610 "strain", could have triggered (partial) destruction of the viral replication machinery and led to lack of further transmission. The changes at the extension platform of the polymerase complex, including the amino acid changes Glu23Asp, Lys37Asn and Lys39Asn, are found in the MT226610 mutant and due to the decrease of positively charged residues, could cause changes in RNA interactions that impinge on the entire enzymatic cycle of RNA elongation. Foremost, it should be considered, that the lack of cleavage of the polyprotein ORF1a/ab to several nsp factors could be diminished by exchange of residue 198 of nsp8 from Gln to His in the MT226610 mutant form, but this may not be the only causal effector. In particular this may not explain the high number of exchanges of nsp8 surface residues, since some main proteases of coronaviridae do accept a His in the position of the cleaved amino acid stretch and, moreover, only few residues may be coupled to the flexible, likely mobile proteolysed amino acid sequence. Other changes in nsp9, nsp16 and ORF8 may have contributed to altered activities and their structures should be further analysed (Fig. 15). Only a model for ORF8 based on ORF7a of SARS-CoV-1 has been here generated: Of prime interest for further studies could be the exchange of Asn74 to Lys in the trimeric S (spike) protein since the amino acid is localized to a putative ligand-binding loop. Although currently based on negative evidence, both, the datamonkey.org server (June 7, 2020 data) and nextstrain.org list no other Asn74 S mutations and thus it may be speculated, that few other SARS-CoV-2s display the same change. Only one other Asn74 S protein mutant is found in the 3887 sequence set. The localization of the packaging signals in SARS-CoV-2 remain a worthwhile goal of studies in a biochemical assay, and it would be interesting to determine, whether the changes in the nsp8 protein of SARS-CoV-2 including the genomic residues 12381 to 12670 in the provisionally determined extinct sub-strain are causally related to lack of viral packaging, propagation and transmission. The results of RNA structure scanning yield first data on this promising route of investigation and indicate, that SLs of RNA may be essential and could form differently in viral mutants. Whether interactions of nsp7-nsp8 with the viral polymerase affected mutations of the original viral strain of Wuhan once mutated and introduced a mutation incidence that was highly increased, is so far unclarified (see SARS-CoV-1 (46) and further structure data). SARS-CoV-2 may carry alternative packaging signals that have been previously localized, for example, to the more centrally located nsp15 in the mouse (hepatitis) coronavirus found at a 3' position relative to nsp8. In SARS-CoV-2 this could be sited in alternative genomic locations. Of high interest would also be to answer the question, whether the here newly described RNA trifoil at the nsp8 3' end and 5' nsp9 junction suppresses the action of polyprotein protease inhibitors, functionally leading to nsp 9, for example (Fig. 11). This may occur by transcription-regulatory sequence in the leader (TRS-L) -dependent noncanonical transcription (47) and for our mutant extinct "clade" and nsp8-nsp9 junction remains a matter of speculation and could be studied by a RNA assay.
Molecular clock analyses have recently allowed to determine the time of evolution of several species and were here applied to the sub-strains of the 2019 zoonotic disease (32). Recent 2019 SARS-CoV-2 outbreak caused respiratory diseases. It is speculated, that the high reproductive rate in the upper respiratory tract alone could account for the deep tissue infection and that the virus would specifically bind to alveolar cells just as to the upper respiratory tissues. The radiological findings in patients are particular ground-glass opacities as well as vascular thickening. I would suggest that, just as in humans (25), the animals that are susceptible to deep infections present the cognate surface in the air-filled organs. These receptors could encompass ACE2, as shown in single-cell analyses for example in mice, or distinct glycans.
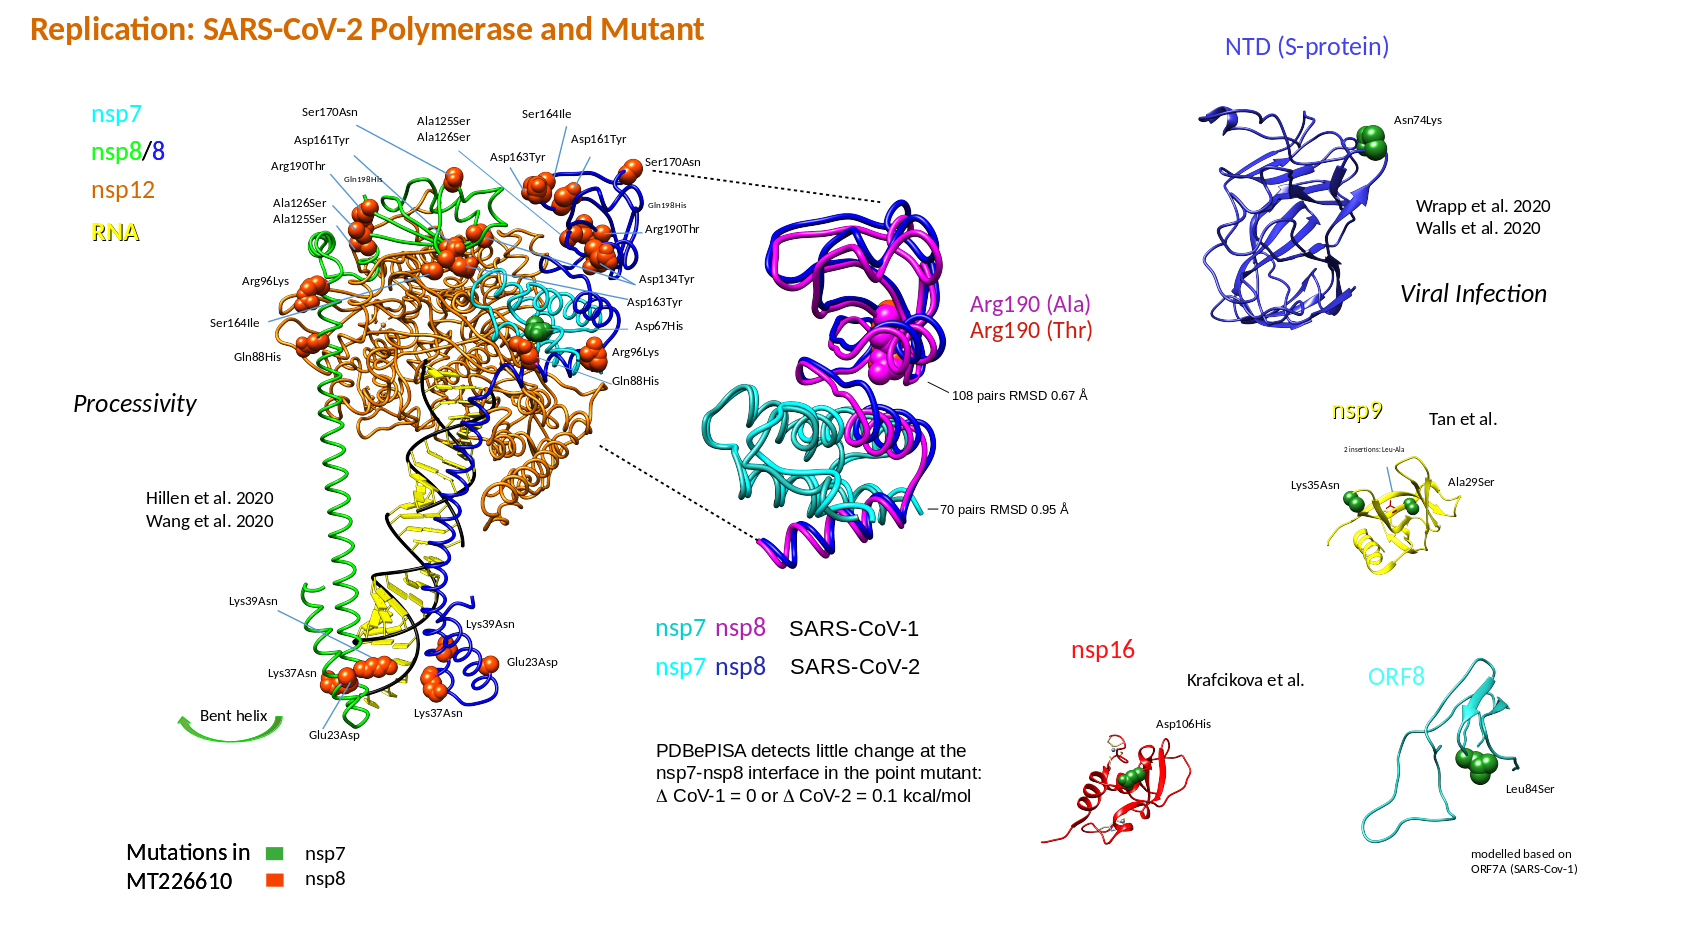
Figure 15: Protein evidence: The decreased evolutionary drive of the mutant MT226610 The structures of SARS-CoV-2 were taken from the PDB archive (RCSB/PDBe) or modelled with Swiss-Model. The polymerase nsp12 associated with nsp7 and nsp8, nsp9, nsp16, the S (spike) protein N-terminal domain (NTD) and ORF8 (modelled) are shown. Structures 6yyt and overlaid 6nur shown in the middle are derived from SARS-CoV-2 and -1 protein preparations, respectively. The Arg190Thr change in nsp8 of SARS-CoV-2, demonstrated to alter enzymatic function in SARS-CoV-1 in an Arg190Ala mutant, is discussed in the text. Amino acids mutated in the sub-strain MT226610 are labelled and indicated in sphere-style. The interface of nsp7-nsp8 with nsp12 in SARS-CoV-1 and -2 may be altered due to some amino acid exchanges.
The structures of SARS-CoV-2 were taken from the PDB archive (RCSB/PDBe) or modelled with Swiss-Model. The polymerase nsp12 associated with nsp7 and nsp8, nsp9, nsp16, the S (spike) protein N-terminal domain (NTD) and ORF8 (modelled) are shown. Structures 6yyt and overlaid 6nur shown in the middle are derived from SARS-CoV-2 and -1 protein preparations, respectively. The Arg190Thr change in nsp8 of SARS-CoV-2, demonstrated to alter enzymatic function in SARS-CoV-1 in an Arg190Ala mutant, is discussed in the text. Amino acids mutated in the sub-strain MT226610 are labelled and indicated in sphere-style. The interface of nsp7-nsp8 with nsp12 in SARS-CoV-1 and -2 may be altered due to some amino acid exchanges.
In infection carbohydrates of several types could play a role, the similarity of the S NTD is but small when compared to galectins and falls in the range of other putative lectins that are speculated to bind to proteins or glycans. Carbohydrates interacting with the SARS-CoV-2 S glycoprotein could be presented on the N-glycan or O-glycan group of proteins or on gangliosides, prevalent viral receptors in the first layer are presented by O-glycans of mucins. Could the attachment to initial binding sites due to esterase enzymatic function or low affinity be superseded by bound carbohydrates in the second layer? I would like to speculate, that, foremost the recombinational power of SARS-CoVs in adaptation to the human host was aided by hyper-variation in the carbohydrate-binding zone (Fig. 2). The preponderance of present sequence adaptations and the selection of distinct viral strains with NTD changes could not be determined with the small sequence set of SARS-CoV-2 genomes available: Evolutionary selection at stages of infection and the purification of select variants, for example, Asp614 versus Gly614 sub-strains and, moreover, compensatory changes in the RBD versus NTD, will become a topic of future studies. The molecular time modelling will require further analyses of coronaviridae from the animal kingdom.
At the current S spike factor variability of 3.8x10⁻⁶ per generation it may take 4 years until each amino acid is exchanged and combined have reached 1/3 of population prevalence. Given a representative set of sequences has been scrutinized in both, the influenza pandemic 2009 and the SARS-CoV-2 pandemic 2019, distinct differences seem to appear: By the earliest sequence measure that presents an estimate of a yearly rate of mutations, comfortingly the SARS-CoV-2 S protein has a 30-fold lower DNA data, or inferred RNA variation index than the HA of influenza H1N1. When the reference period is changed from 4 to 6.5 months for the influenza virus sequence collection, the number is elevated by 13%.
In the codon use analysis, it is certainly of interest that the 1109 SARS-CoV-2 S genomic sequences can be found to be highly elevated in U contents similarly to HCoV-HKU with 33.25% U, 18.92% C, 29.43% A and 18.39% G (33). HKUs are endemic in humans and have been speculated to be U-dependent in evolution. It will be interesting to determine, whether in SARS-CoV-2 a similar codon usage affects the immune escape of the virus. Exchanges of amino acids may also be interdependent with the codon bias indices for SARS-CoV-2. Thus, it could generate a pattern of preferred changes in the protein that evolves during early viral replication. So far, third position exchanges lead to preservation of U-contents. Whether the codon preferences determined the non-synonymous to synonymous mutations without selection pressure in the early phase of the SARS-CoV-2 pandemic spread remains to be seen. The preferred exchange from A to G in the second position is due to sub-strain formation.
In lack of current clear evidence for selection of the Asp614Gly sub-strain, it is prudent to propose that it is preferred human carrier mobility that had contributed to the large SARS-CoV-2 pandemic spread of the Gly614-type. Yet, already available data from www.datamonkey.org and GISAID pertaining to a data set with approximately 10000 sequenced SARS-CoV-2 genomes suggest, that the site Asp614Gly is generally under positive selection (see also 49). A combination of both, mobility and selection is thus the most plausible scenario that now has appeared. The similarity of the "extinct" strain MT226610 to RaTG13 in nucleotide position 8782 (ORF1ab) and 28144 (ORF8) may suggest a preserved ancestral state, yet could involve reversions that have not been determined in wildlife. With the new list of possible targets (Fig. 9 and Table 4), drug developments in relation to the "extinct" sub-strains and their supposed decreased fitness may be feasible. The targeting of the 5' UTR as predicted by further sub-strain MT326179 scrutiny could be further considered.
Whether the MT226610 sub-strain with clustered nsp8 mutations corresponds to classical examples of E. coli dnaE and T4 gene 43 or to a combination of first-hit and evolutionary changes, just as the MT326179 5' changes may well reflect, remains to be shown in future studies. Since the sub-strain MT326179 displays only 13 unique changes, whereas the MT226610 sub-strain incurred 23 unique mutations, the first was not listed as a distinct "clade" whereas the latter formed a uniquely rooted branch as determined by the exchange and phylogenesis modelling.
In a new BLAST search carried out on 19 December 2020, neither the clustered mutations in bases 12000 to 13000 of MT226610, nor the exchanges in the 5' UTR SL5b of MT326179 have been found in another SARS-CoV-2 isolate, and both sub-strains could be considered as extinct.
Methods
CLUSTAL X (34) or MAFFT on mafft.cbrc.jp/alignment/server was used for sequence alignment, PDBeFold (6) for searching the PDB structure database. The TBLASTN search (21) was conducted on 22 March 2020 utilizing the sequence of NC045512 with the NCBI tools on the blast.ncbi.nlm.nih.gov website, and the further BLAST nucleotide searches were carried through on EMBL-EBI www.ebi.ac.uk. The NCBI virus sequence resources were queried or Genbank. Genbank was searched on 14 April 2020 for SARS-CoV-2 for 507 S protein entries (11 February 2020 - 10 April 2020 submission dates) or for 1109 S protein entries (11 February 2020 - 23 April 2020 submission dates) on 26 April 2020; influenza virus HA nucleotide sequences for comparative analysis were downloaded for the period from 1 January 2009 - 16 July 2009 or 1 January 2009 - 30 April 2009. The downloaded sequences from 1 January 2009 - 30 April 2009 were derived mostly from a collection in end of March and April from USA, United Kingdom, Canada, Mexico, France, Brazil, Netherlands, Israel, Hong Kong, Germany, Denmark and Spain. The large SARS-CoV-2 data set (4557 sequences) was downloaded on 26 May 2020 and included submissions up to 21 May 2020. The SARS-CoV-1 sequences were available in partially annotated form and therefore a BLAST search was used to retrieve the sequences with submission or collections dates from 2003 - 2018.
The Swiss-Model Server was used for modelling (23). The coverage given by the programme was 0.99 with a QMEAN of -2.62 as indicated with a 6vsbA template. In total, 38 templates were applied for the models. The “grafted glycan” was visualized in UCSF Chimera 1.14 (35). The odds ratio and CI (confidence interval) for statistics were calculated with a calculator and Excel 2013 (Microsoft). GIMP 2.10.14 was used for image processing. A Windows 10 (Microsoft) computer with an Intel i7-7700K or a Fedora 32 (Gnome 3.36.2, Wayland) laptop with an Intel i7-5500U processor were used. Estimates of amino acid replacement are based on the accumulated S genomic and translated amino acid sequences. The estimates are based on an augmented parsimonious approach of counts that may underestimate the rate at the lowest level, the highest level considers each replacement. Sequence statistics were obtained with MEGA X (28). Nucleotide composition and codon preferences were analysed therein. The codon preference corresponded to the expected frequency when all codons would be used equally. The index was derived from weighting each codon with the preference and dividing by the number of observed codons. The yearly mutation rate was estimated based on the average sequence distance assuming a generation time of 7 days (and could be multiplied if shorter times apply). The estimate is independent of precise sequence submission date and could introduce the exact pairwise timely separations. The estimate for the SARS-CoV-2 is based on clinical isolates and does not use tissue-cultured virus sequences. In the SARS-CoV analysis, patented sequences were excluded, the H1N1 sequences were restricted to the pandemic strain in the sequence download. Strain sub-groups were calculated in divergence from the reference with the genomic RNA sequences using the NC045512 sequence as an outlier. In this clock analysis all sequences similar to the reference were omitted. Cluster determination of sequences was carried through by extraction of sequence data for centre or city of data submission. Settings for the phylogenetic tree algorithms are indicated with each panel and applied a Poisson model for amino acid or Tamura-Nei (TN) model for nucleotide substitution. A molecular clock was introduced with MEGA X to analyse the sequences including MN996532. It was applied with the uniform rate of substitutions in a Jones-Taylor-Thornton model with a maximum-likelihood approach using a bootstrap. The heuristic method was set to nearest neighbour- interchange using all sites without branch-swap filter. Only complete entries (lacking unambiguous codon translations) of SARS-CoV-2 S glycoprotein were used for the alignments of the 507 retrieved sequences. For the nucleotide Tamura-Nei (uniform rates) model a 99% cut-off for partial deletion of sites was set in some analyses when sequence ambiguities were determined in the alignment.
Descriptions concerning the 1109 sequenced SARS-CoV-2s included the complete entries without omission of lower quality sequence reads. The 4557 SARS-CoV-2 sequences were filtered for ambiguities or gaps with a 4% cut-off and a trade-off in quality versus completeness, assuming a genomic variation rate of approximately 30 changes that yielded a 40-fold relaxed inclusion: Sequences with 5' adapters were excluded and to harmonize 5'- and 3'-ends the sequences were cut at position 38 and 29834 (ref. seq. numbering) where sequence changes for technical reasons seemed obvious. Sequence qualities for "top scoring mutational count genomes" were tested for presence of adapters by FastQC without positive result (MT226610, MT326179). The mutation count in the 3887 sequence set was generated omitting deletions that are infrequently found in the SARS-CoV-2 genomes. The top score sequence of 29 mutations (MT326179) does contain a stretch of 7 clustered mutations and 1 del in position 226-241 (ref. seq. numbering) which may occur by chance in other genomes. IQ-TREE was used with UFBoot, and with or without the site concordance factor setting for sampling around internal branches (38, 39) with FigTree 1.4.4 for tree drawing. Trees were scrutinized with the command line version of IQ-Tree and the 'iqtree-2.0.5-Windows\bin\iqtree2.exe -s Seq.fas --date MappeDates.txt --date-ci 100 --date-options -e 0 -B 1000 -bnni -m TN+F+I -alrt 1000 -T 4' command. Frequencies and rates were modelled for the reference set of 200 nucleotide sequences chosen according to the Bayesian information criterion and introduced to the 4557 data set. Overall, the phylogenetic dating procedure was tested for its sensitivity to wronly dated single sequences, two sequences inadvertently dated to 1907, for example, did not drastically affect the tMRCA results. SimPlot 3.5.1 was used for sequence comparison. Epanechnikov kernel smoothing disregarding outliers was used for some visualizations with SPSS (IBM).
The estimate of non-synonymous to synonymous changes was applied with the 95% for SARS-CoV-1 or 99% partial deletion option with all other sequence sets. Results on the neutrality of sequence pairs were obtained from the Fisher’s Exact test (36). All sites with less than 95% coverage were eliminated, 200 representative nucleotide sequences were used. This representative set of 200 sequences was generated on 26 April 2020. Pairwise distances were determined with a 99% partial deletion cut-off. The Li-Wu-Luo method was used to determine the nonsynonymous to synonymous changes for the sequence sets. SLAC was carried out with the Datamonkey.Org servers on www.datamonkey.org/slac and 209 representative sequences of 1109 submitted sequences and analysed 1273 sites.
RNA folding experiments were carried out with RNAstructure 1.0 using the search templates that were provided by ScanFold (Moss Lab). ScanFold was used with default settings except randomizations that were increased to 50. The output was collated in spreadsheets using the data in (40) as reference for comparison with NC045512. "Barriers" or RNAfold were accessed on rna.tbi.univie.ac.at and used to analyse the folding paths of RNA and intermediates of folding (49); structures were schematically graphed with VARNA. Further energies were calculated by RNAstructure 6.2, the MFold web-server, accessed on unafold.rna.albany.edu, and with LinearFold accessed on linearfold.org (50).
ClusPro (51) was used for protein docking and to determine the inferred binding of nsp7 to nsp8 in the absence of other polymerase factors. Default settings on the website www.cluspro.org were used.
Concluding Remarks
Origin of SARS-CoV-2
There is currently no indication, that the newly isolated metagenomic RmYN02 coronavirus strain (Yunnan) (52)
which is more similar to SARS-CoV-2 NC045512 (Wuhan) in ORF1ab than to the RaTG13 strain (Yunnan), carries a higher similarity in nsp7-nsp8 coding regions to MT226610. This suggests, that the RmYN02 polymerase (including associated co-factors) has not the similar RNA or amino acid sequence
than MT226610.
Mechanism of SARS-CoV-2 Extinction
Neglecting possible lack of accuracy in sequencing (MT326179), both sub-strains, MT226610 and MT326179, are not likely to have arisen from immune RNA-editing as suggested for some mutations in the analysis of 46723 SARS-CoV-2
sequences, since only two changes each therein (MT226610 in bases 12000 to 13000 and MT326179 in SL5b) correspond to the expected C-U change only one including preferred trinucleotides (counting + and - RNAs) (53).
The maximum-likelihood nucleotide exchange probabilities (transitions/transversions) with or without TN phylogenetic modelling are shown for the 3877 SARS-CoV-2 genomic sequences .
Intra-patient Virus Mutations
Intra-host nucleotide variations have been described in more detail recently (54, 55).
Variants of SARS-CoV-2 in Focus
Previous evidence on porcine TGEV α-coronavirus (transmissible gastroenteritis virus) (56) and similarity of the NTD of the S-protein of α- to β-coronaviridae (57) would suggest (distances of 9-22 Å can
be found in modelled and overlaid structures of His69 of SARS-CoV-2 S to TGEV S residues 72 and 219 wherein the latter or both have been implicated
), that altered tissue-tropism
akin to organ-tropism in different strains (56), could affect
and possibly cause more rapid spread of the British "B.1.1.7 variant" of SARS-CoV-2
(59)
including the discussed His69Val70 S protein NTD deletion. The NTD deletion causes a two-fold higher viral infectivity mediated by the S protein
(60).
Just as the "B.1.351 variant"
(61) is the "B.1.1.7 variant" predicted to show increased interaction
of the S protein RBD with the cellular ACE2 receptor (62).
The South African "B.1.351 variant", moreover, contains further changes in the NTD which are displayed on the
same side in both, "B.1.1.7" and "B.1.351", and are here speculated to alter affinity to a proteinaceous or glycosidic co-receptor. Although the
biological mechanism has not yet been clarified, the AB0 blood group locus has been implicated in the severity of COVID-19
(63, see references within) and one should not exclude the possibility,
that a relationship to virus-cell tropism exists. The structure of the S protein bound to an antibody (64) is well suited
to describe the mutations in the Brazilian "B.1.1.28.1 variant" or "P.1" that contains several N-terminal changes in Leu18, Thr20 and Pro26
(65). This variant, just as the other two sub-strains of SARS-CoV-2, is predicted
to show enhanced binding to ACE2 via the altered RBD of the spike (62),
in contrast to the other variants "B.1.1.28.1" or "P.1" contains a buried residue Arg190 (depending on the S protein structure)
exchanged to Ser that may alter interaction, in particular
with the loop described for TGEV in sialic-acid binding, should the loop be mobile. Residues 100-175 of the NTD have been shown to interact with the ganglioside GM1 in a model of 6vsb, contacting
residues surrounding the Wuhan isolate insert 2 (Supplementary Fig. 2, see SignalP prediction of the SARS-CoV-2 signal-sequence), and it will be interesting to elucidate,
whether tissue-tropism could be altered by further changes in this binding site
(66). The current status on the N-terminus of the S protein would suggest,
that in HEK 293F cells the secreted protein and likely normally folded structure (7c2l, (64)),
resolved by cryo-EM, covers the centre of the proposed binding site of the ganglioside GM1 and interaction thus becomes less likely. Unless the N-terminus of the S protein
would be displaced or unlikely "entrenched" in the binding reaction, neither the monomer nor dimer would strongly interact. The necessity of a
(principally possible) redox reaction that could liberate the N-terminal residues from the binding pocket, if the second amino acid Cys15 is linked to Cys136 by a disulfide bridge,
makes the former hypothesis a distinct although unexplored possibility. The role of the thiol-disulfide balance in cellular viral infection had been reviewed recently
(67).
The concern on the rationale to apply hydroxychloroquine in COVID-19, previously suggested and
possibly linked to ganglioside binding, is now mentioned in this investigative report
(68).
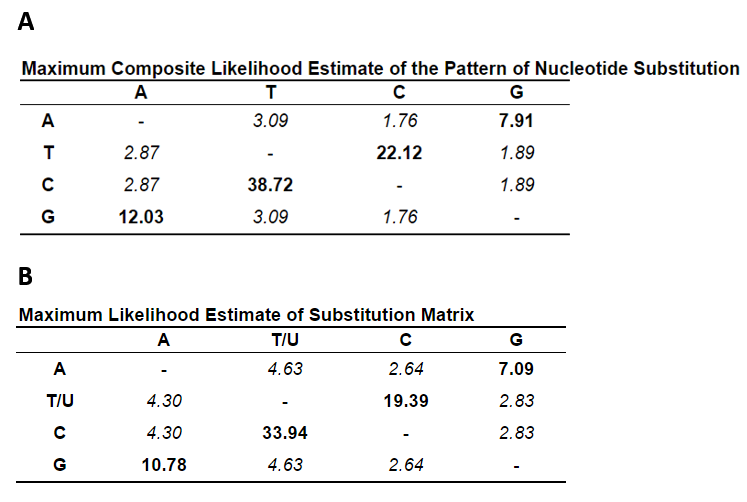
Addendum: (A) Each entry shows the probability of substitution (r) from one base (row) to another base (column). For simplicity, the sum of r values is made equal to 100. Rates of different transitional substitutions are shown in bold and those of transversionsal substitutions are shown in italics. The nucleotide frequencies are 29.86% (A), 32.14% (T/U), 18.36% (C), and 19.64% (G). The transition/transversion rate ratios are k1 = 4.192 (purines) and k2 = 12.535 (pyrimidines). The overall transition/transversion bias is R = 3.942, where R = [A*G*k1 + T*C*k2]/[(A+G)*(T+C)]. This analysis involved 3877 nucleotide sequences. Codon positions included were 1st+2nd+3rd+Noncoding. All positions with less than 5% site coverage were eliminated, i.e., fewer than 95% alignment gaps, missing data, and ambiguous bases were allowed at any position (partial deletion option). There were a total of 29796 positions in the final dataset. (B) Each entry is the probability of substitution (r) from one base (row) to another base (column). Substitution pattern and rates were estimated under the Tamura-Nei model (see (32)). Rates of different transitional substitutions are shown in bold and those of transversionsal substitutions are shown in italics. Relative values of instantaneous r should be considered when evaluating them. For simplicity, sum of r values is made equal to 100, The nucleotide frequencies are A = 29.86%, T/U = 32.14%, C = 18.36%, and G = 19.64%. For estimating ML values, a tree topology was automatically computed. The maximum Log likelihood for this computation was -79430.804. This analysis involved 3877 nucleotide sequences. Codon positions included were 1st+2nd+3rd+Noncoding. All positions with less than 5% site coverage were eliminated, i.e., fewer than 95% alignment gaps, missing data, and ambiguous bases were allowed at any position (partial deletion option). There were a total of 29796 positions in the final dataset. Evolutionary analyses were conducted in MEGA X (28).
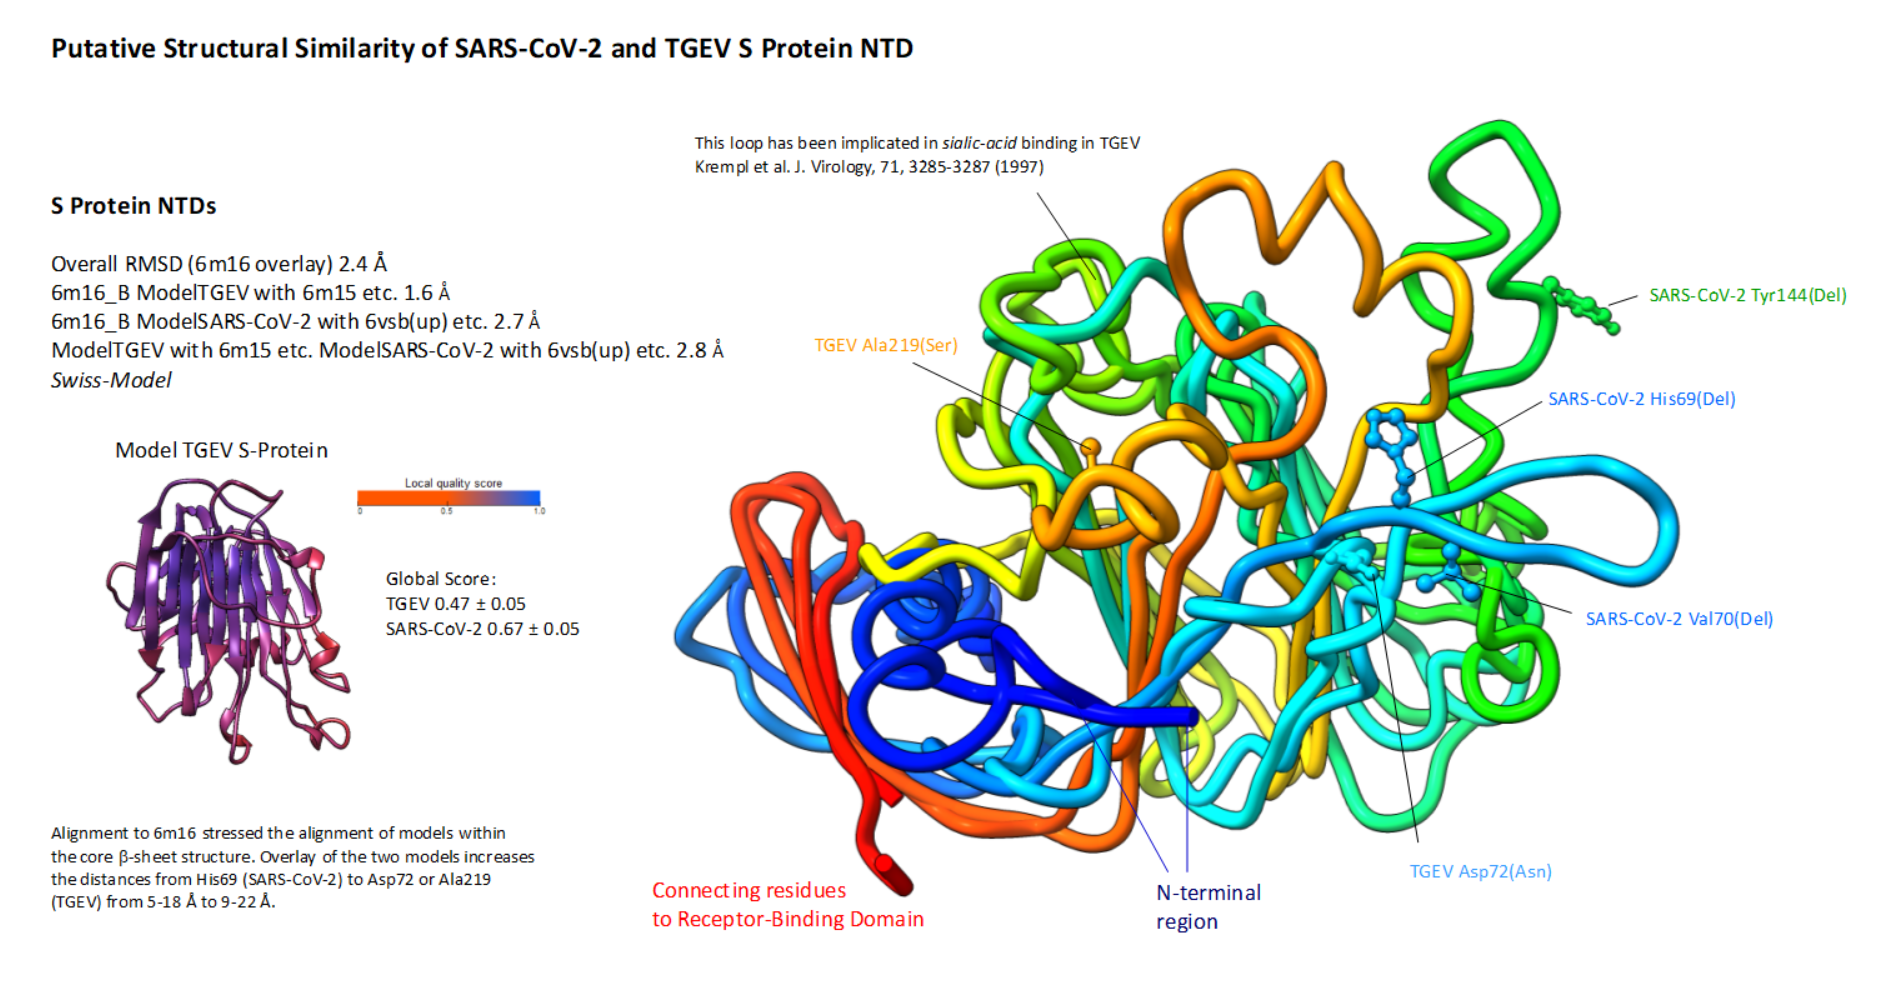
Structural Similarity of SARS-CoV-2 and TGEV NTD: The SWISS-MODEL template library (SMTL version 2020-12-30, PDB release 2020-12-25) was searched with BLAST and HHBlits (see (23)) for evolutionary related structures matching the target TGEV NTD sequence. Overall 76 templates were found that were used for modelling. The TGEV model obtained a score of QMEAN -5.74 (model coverage 0.86) and a QMEANDisCo global score of 0.47 ±0.05 (58).
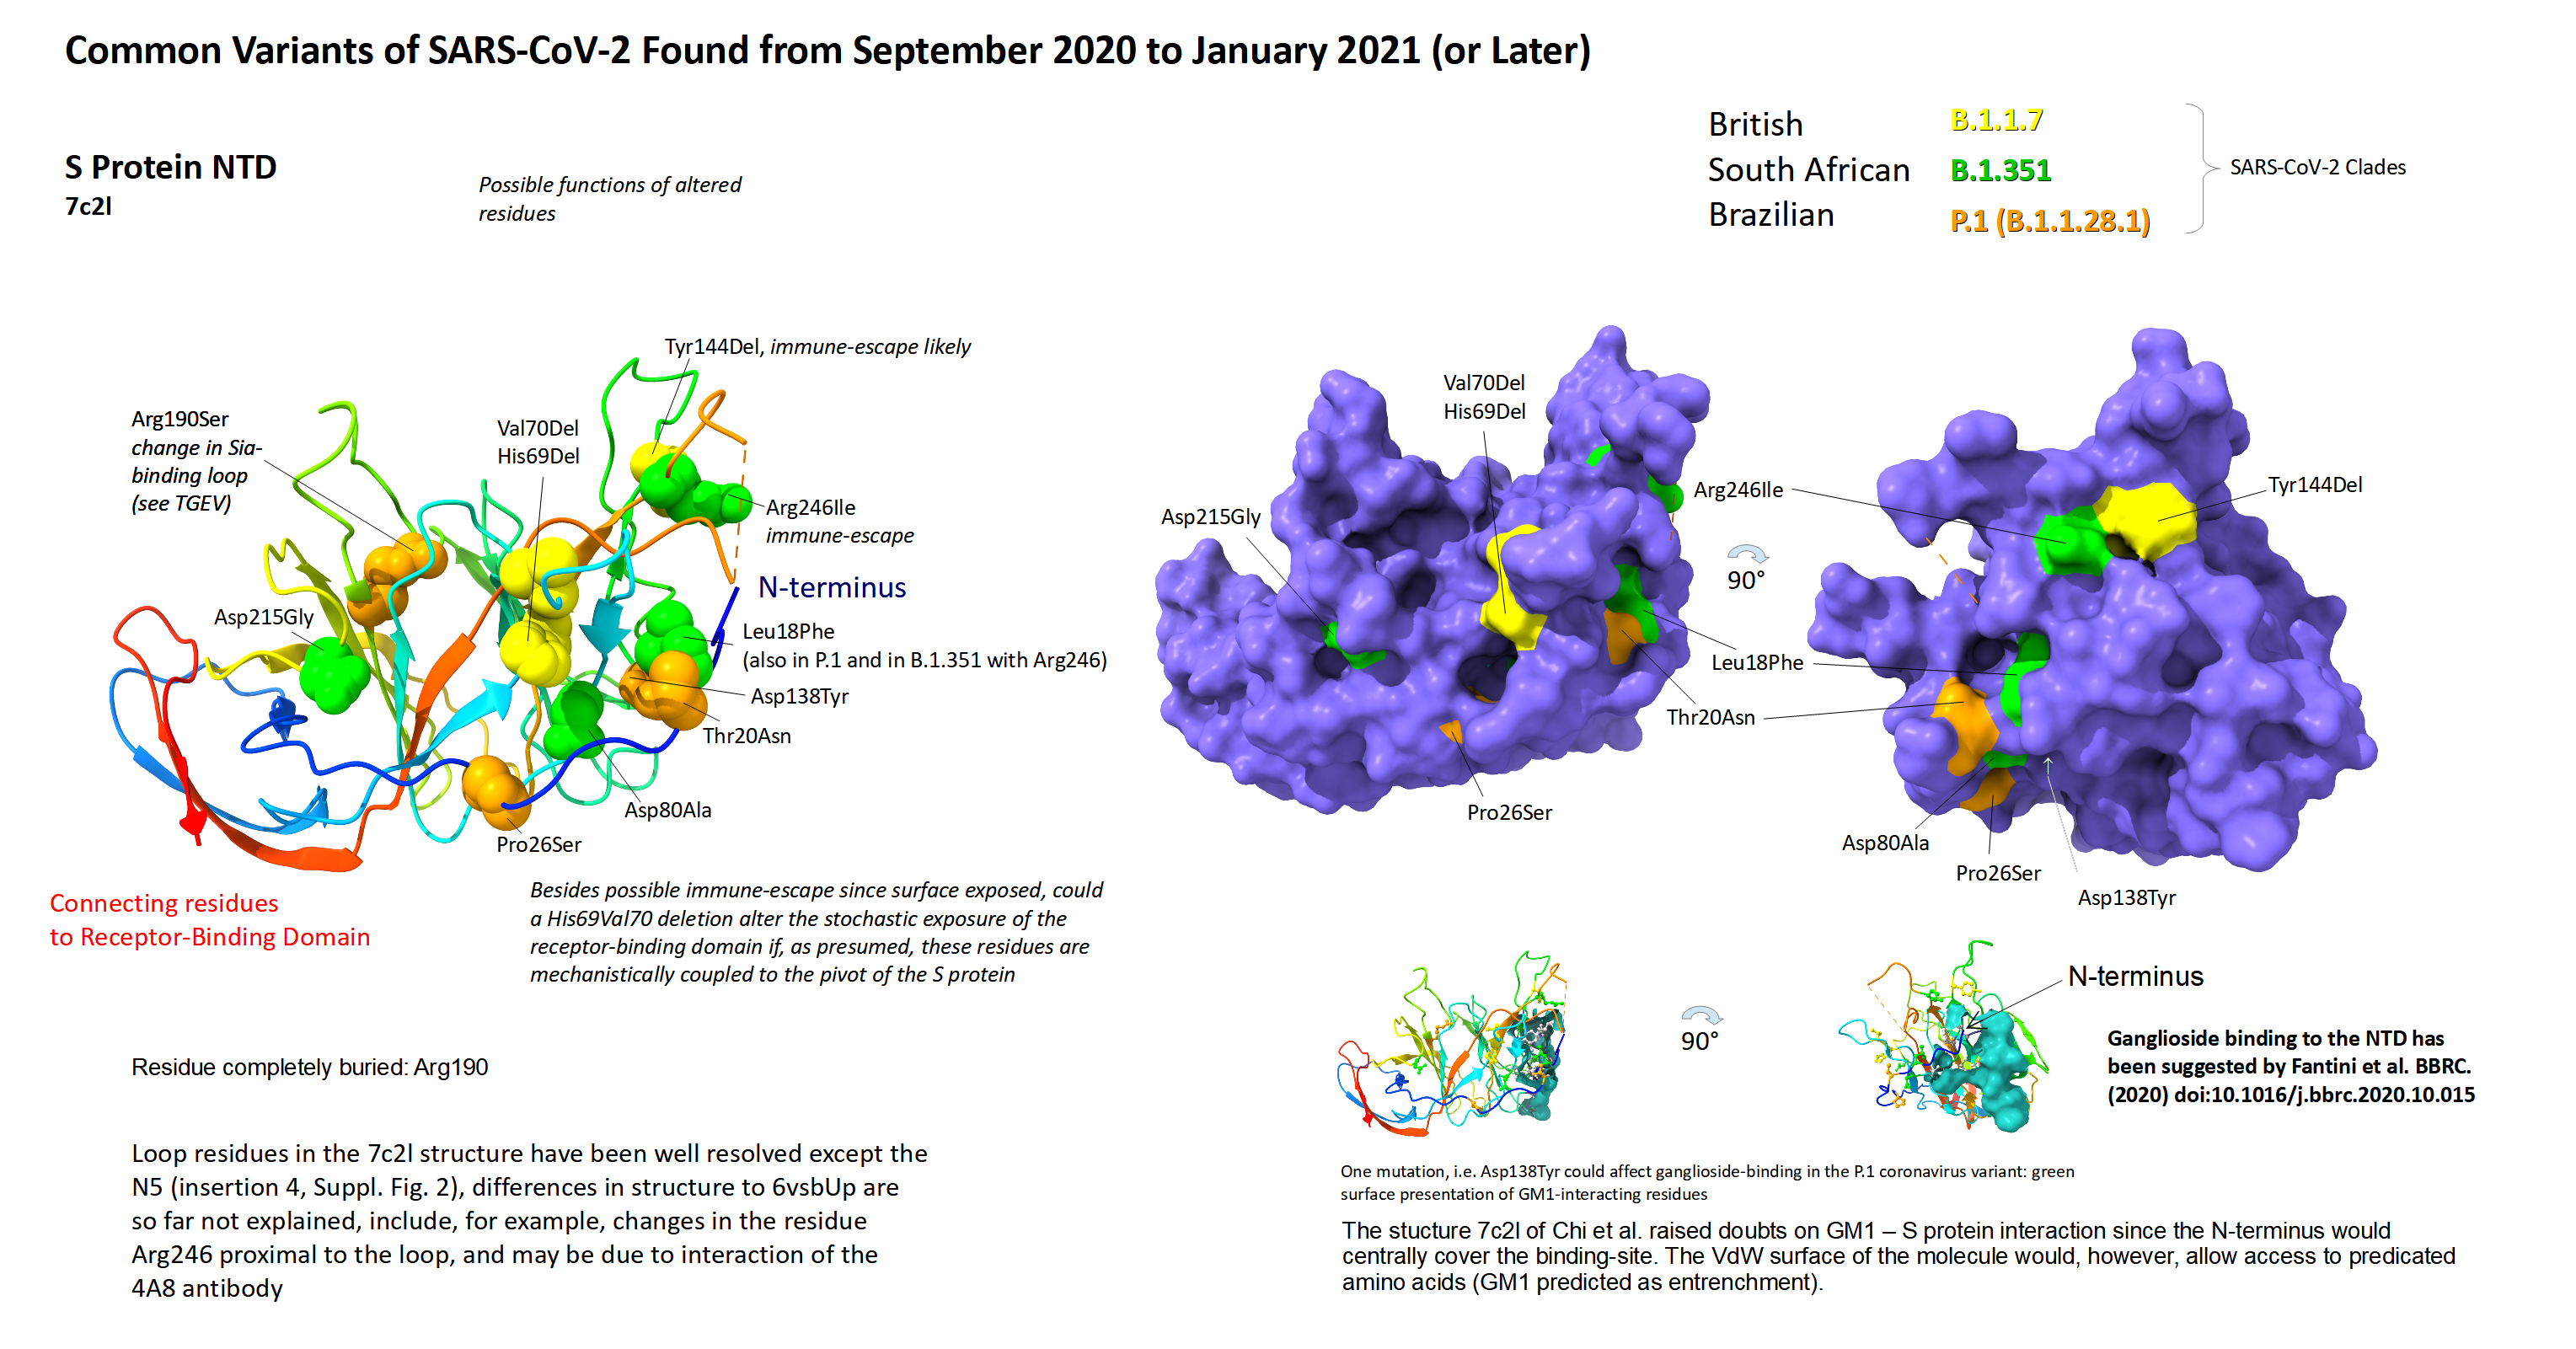
SARS-CoV-2 Variants: The variants of SARS-CoV-2 discussed recently were visualized on the S protein structure 7c2l. The British variant contains several S protein changes: His69Del, Val70Del, Tyr144Del, Asn501Tyr, Ala570Asp, Pro681His, Thr716Ile, Ser982Ala and Asp1118His. The South African cluster (S.501Y.V2) contains Asp80Ala, Asp215Gly, Glu484Lys, Asn501Tyr, Ala701Val and further Leu18Phe, Arg246Ile, Lys417Asn changes in S. The Brazilian variant contains the following changes Leu18Phe, Thr20Asn, Pro26Ser, Asp138Tyr, Arg190Ser, Lys417Thr, Glu484Lys, Asn501Tyr, His655Tyr and Thr1027Ile in S. Additional changes in all three lineages and their parents can be found on cov-lineages.org. The B.1 or B.1.1 lineages are derived from SARS-CoV-2 mutants that carried the Asp614Gly S protein change.
References
1. A. C. Walls, Y.-J. Park, M. A. Tortorici, A. Wall, A. T. McGuire, D. Veesler, Structure, Function, and Antigenicity of the SARS-CoV-2 Spike Glycoprotein. Cell. 180, 1-12 (2020).
2. D. Wrapp, N. Wang, K. S. Corbett, J. A. Goldsmith, C.-L. Hsieh, O. Abiona, B. S. Graham, J. S. McLellan, Cryo-EM structure of the 2019-nCoV spike in the prefusion conformation. Science. 367, 1260-1263 (2020).
3. W. Li, Z. Shi, M. Yu, W. Ren, C. Smith, J. H. Epstein, H. Wang, G. Crameri, Z. Hu, H. Zhang, J. Zhang, J. McEachern, H. Field, P. Daszak, B. T. Eaton, S. Zhang, L.-F. Wang, Bats Are Natural Reservoirs of SARS-Like Coronaviruses. Science. 310, 676-679 (2005).
4. P. Zhou, X.-L. Yang, X.-G. Wang, B. Hu, L. Zhang, W. Zhang, H.-R. Si, Y. Zhu, B. Li, C.-L. Huang, H.-D. Chen, J. Chen, Y. Luo, H. Guo, R.-D. Jiang, M.-Q. Liu, Y. Chen, X.-R. Shen, X. Wang, X.-S. Zheng, K. Zhao, Q.-J. Chen, F. Deng, L.-L. Liu, B. Yan, F.-X. Zhan, Y.-Y. Wang, G.-F. Xiao, Z.-L. Shi, A pneumonia outbreak associated with a new coronavirus of probable bat origin. Nature. 579, 270-273 (2020).
5. G. Peng, L. Xu, Y.-L. Lin, L. Chen, J. R. Pasquarella, K. V. Holmes, F. Li, Crystal Structure of Bovine Coronavirus Spike Protein Lectin Domain. J Biol Chem. 287, 41931-41938 (2012).
6. E. Krissinel, K. Henrick, Secondary-structure matching (SSM), a new tool for fast protein structure alignment in three dimensions. Acta Crystallogr. Sect. D. 60, 2256-2268 (2004).
7. R. J. G. Hulswit, Y. Lang, M. J. G. Bakkers, W. Li, Z. Li, A. Schouten, B. Ophorst, F. J. M. van Kuppeveld, G.-J. Boons, B.-J. Bosch, E. G. Huizinga, R. J. de Groot, Human coronaviruses OC43 and HKU1 bind to 9-O-acetylated sialic acids via a conserved receptor-binding site in spike protein domain A. Proc. Natl. Acad. Sci. 116, 2681-2690 (2019).
8. X. Tang, C. Wu, X. Li, Y. Song, X. Yao, X. Wu, Y. Duan, H. Zhang, Y. Wang, Z. Qian, J. Cui, J. Lu, On the origin and continuing evolution of SARS-CoV-2. Natl. Sci. Rev., nwaa036 (2020).
9. F. Wu, S. Zhao, B. Yu, Y.-M. Chen, W. Wang, Z.-G. Song, Y. Hu, Z.-W. Tao, J.-H. Tian, Y.-Y. Pei, M.-L. Yuan, Y.-L. Zhang, F.-H. Dai, Y. Liu, Q.-M. Wang, J.-J. Zheng, L. Xu, E. C. Holmes, Y.-Z. Zhang, A new coronavirus associated with human respiratory disease in China. Nature. 579, 265-269 (2020).
10. M. Hoffmann, H. Kleine-Weber, S. Schroeder, N. Kruger, T. Herrler, S. Erichsen, T. S. Schiergens, G. Herrler, N.-H. Wu, A. Nitsche, M. A. Muller, C. Drosten, S. Pohlmann, SARS-CoV-2 Cell Entry Depends on ACE2 and TMPRSS2 and Is Blocked by a Clinically Proven Protease Inhibitor. Cell. 181, 271-280 (2020).
11. R. Yan, Y. Zhang, Y. Li, L. Xia, Y. Guo, Q. Zhou, Structural basis for the recognition of SARS-CoV-2 by full-length human ACE2. Science. 367, 1444-1448 (2020).
12. R. Cagliani, D. Forni, M. Clerici, M. Sironi, Computational Inference of Selection Underlying the Evolution of the Novel Coronavirus, Severe Acute Respiratory Syndrome Coronavirus 2. J. Virol. 94, e00411-20 (2020).
13. V. B. Rodriguez, B. A. Kidd, G. Interlandi, V. Tchesnokova, E. V Sokurenko, W. E. Thomas, Allosteric coupling in the bacterial adhesive protein FimH. J. Biol. Chem. 288, 24128-24139 (2013).
14. The Chinese SARS Molecular Epidemiology Consortium, Molecular evolution of the SARS coronavirus during the course of the SARS epidemic in China. Science. 303, 1666-1669 (2004).
15. Y. Guan, B. J. Zheng, Y. Q. He, X. L. Liu, Z. X. Zhuang, C. L. Cheung, S. W. Luo, P. H. Li, L. J. Zhang, Y. J. Guan, K. M. Butt, K. L. Wong, K. W. Chan, W. Lim, K. F. Shortridge, K. Y. Yuen, J. S. M. Peiris, L. L. M. Poon, Isolation and characterization of viruses related to the SARS coronavirus from animals in southern China. Science. 302, 276-278 (2003).
16. I. F. N. Hung, V. C. C. Cheng, A. K. L. Wu, B. S. F. Tang, K. H. Chan, C. M. Chu, M. M. L. Wong, W. T. Hui, L. L. M. Poon, D. M. W. Tse, K. S. Chan, P. C. Y. Woo, S. K. P. Lau, J. S. M. Peiris, K. Y. Yuen, Viral loads in clinical specimens and SARS manifestations. Emerg. Infect. Dis. 10, 1550-1557 (2004).
17. L. Zou, F. Ruan, M. Huang, L. Liang, H. Huang, Z. Hong, SARS-CoV-2 Viral Load in Upper Respiratory Specimens of Infected Patients. N. Engl. J. Med. 382, 1177-1179 (2020).
18. W. Song, M. Gui, X. Wang, Y. Xiang, Cryo-EM structure of the SARS coronavirus spike glycoprotein in complex with its host cell receptor ACE2. PLOS Pathog. 14, e1007236 (2018).
19. R. Sánchez, A. Sali, Evaluation of comparative protein structure modeling by MODELLER-3. Proteins. Suppl 1, 50-8 (1997).
20. N. Guex, M. C. Peitsch, SWISS-MODEL and the Swiss-Pdb Viewer: An environment for comparative protein modeling. Electrophoresis. 18, 2714-2723 (1997).
21. S. F. Altschul, W. Gish, W. Miller, E. W. Myers, D. J. Lipman, Basic local alignment search tool. J. Mol. Biol. 216, 403-410 (1990).
22. M. A. Tortorici, A. C. Walls, Y. Lang, C. Wang, Z. Li, D. Koerhuis, G.-J. Boons, B.-J. Bosch, F. A. Rey, R. J. de Groot, D. Veesler, Structural basis for human coronavirus attachment to sialic acid receptors. Nat Struct Mol Biol. 26, 481-489 (2019).
23. N. Guex, M. C. Peitsch, T. Schwede, Automated comparative protein structure modeling with SWISS-MODEL and Swiss-PdbViewer: a historical perspective. Electrophoresis. 30 Suppl 1, S162-73 (2009).
24. S. K. Chothe, G. Bhushan, R. H. Nissly, Y.-T. Yeh, J. Brown, G. Turner, J. Fisher, B. J. Sewall, D. M. Reeder, M. Terrones, B. M. J. & S. V. Kuchipudi, Avian and human influenza virus compatible sialic acid receptors in little brown bats. Sci. Rep. 7, 660 (2016).
25. K. Shinya, M. Ebina, S. Yamada, M. Ono, N. Kasai, Y. Kawaoka, Influenza virus receptors in the human airway. Nature. 440, 435-436 (2006).
26. W. Wang, J. Lu, C. R. Cotter, K. Wen, H. Jin, Z. Chen, Identification of Critical Residues in the Hemagglutinin and Neuraminidase of Influenza Virus H1N1pdm for Vaccine Virus Replication in Embryonated Chicken Eggs. J. Virol. 87, 4642-4649 (2013).
27. N. C. Wu, A. J. Thompson, J. Xie, C.-W. Lin, C. M. Nycholat, X. Zhu, R. A. Lerner, J. C. Paulson, I. A. Wilson, A complex epistatic network limits the mutational reversibility in the influenza hemagglutinin receptor-binding site. Nat. Commun. 9, 1264 (2018).
28. S. Kumar, G. Stecher, M. Li, C. Knyaz, K. Tamura, MEGA X: Molecular evolutionary genetics analysis across computing platforms. Mol. Biol. Evol. 35, 1547-1549 (2018).
29. X. Zhang, Y. Tan, Y. Ling, G. Lu, F. Liu, Z. Yi, X. Jia, M. Wu, B. Shi, S. Xu, J. Chen, W. Wang, B. Chen, L. Jiang, S. Yu, J. Lu, J. Wang, M. Xu, Z. Yuan, Q. Zhang, X. Zhang, G. Zhao, S. Wang, S. Chen, H. Lu, Viral and host factors related to the clinical outcome of COVID-19. Nature, 583, 437-440 (2020).
30. R. Li, S. Pei, B. Chen, Y. Song, T. Zhang, W. Yang, J. Shaman, Substantial undocumented infection facilitates the rapid dissemination of novel coronavirus (SARS-CoV-2). Science. 368, 489-493 (2020).
31. S. L. Kosakovsky Pond, S. D. W. Frost, Not so different after all: a comparison of methods for detecting amino acid sites under selection. Mol. Biol. Evol. 22, 1208-1222 (2005).
32. K. Tamura, F. U. Battistuzzi, P. Billing-Ross, O. Murillo, A. Filipski, S. Kumar, Estimating Divergence Times in Large Molecular Phylogenies. Proc. Natl. Acad. Sci. 109, 19333-19338 (2012).
33. B. Berkhout, F. van Hemert, On the biased nucleotide composition of the human coronavirus RNA genome. Virus Res. 202, 41-47 (2015).
34. D. Higgins, J. Thompson, T. Gibson, Using CLUSTAL for multiple sequence alignments. Methods Enzym. 266, 383-402 (1996).
35. E. F. Pettersen, T. D. Goddard, C. C. Huang, G. S. Couch, D. M. Greenblatt, E. C. Meng, T. E. Ferrin, UCSF Chimera - a visualization system for exploratory research and analysis. J. Comput. Chem. 25, 1605-12 (2004).
36. M. Nei, T. Gojobori, Simple methods for estimating the numbers of synonymous and nonsynonymous nucleotide substitutions. Mol. Biol. Evol. 3, 418-426 (1986).
37. T. N. Petersen, S. Brunak, G. von Heijne, H. Nielsen, SignalP 4.0: discriminating signal peptides from transmembrane regions. Nat. Methods. 8, pp. 785-786 (2011).
38. J. Trifinopoulos, L.-T. Nguyen, A. von Haeseler, B. Q. Minh, W-IQ-TREE: a fast online phylogenetic tool for maximum likelihood analysis. Nucleic Acids Res. 44, W232–W235 (2016).
39. B. Q. Minh, M. W. Hahn, R. Lanfear, New methods to calculate concordance factors for phylogenomic datasets. Mol. Biol. Evol. 37, 2727–2733 (2020).
40. R. J. Andrews, J. M. Peterson, H. S. Haniff, J. Chen, C. Williams, M. Grefe, M. D. Disney, W. N. Moss, An in silico map of the SARS-CoV-2 RNA Structurome. bioRxiv. (2020).
41. P. S. Masters, Coronavirus genomic RNA packaging. Virology. 537, 198–207 (2019).
42. R. Rangan, I. N. Zheludev, R. Das, RNA genome conservation and secondary structure in SARS-CoV-2 and SARS-related viruses. bioRxiv. (2020).
43. H. S. Hillen, G. Kokic, L. Farnung, C. Dienemann, D. Tegunov, P. Cramer, Structure of replicating SARS-CoV-2 polymerase. Nature. 584, 154–156 (2020).
44. Q. Wang, J. Wu, H. Wang, Y. Gao, Q. Liu, A. Mu, W. Ji, L. Yan, Y. Zhu, C. Zhu, X. Fang, X. Yang, Y. Huang, H. Gao, F. Liu, J. Ge, Q. Sun, X. Yang, W. Xu, Z. Liu, H. Yang, Z. Lou, B. Jiang, L. W. Guddat, P. Gong, Z. Rao, Structural Basis for RNA Replication by the SARS-CoV-2 Polymerase. Cell. 182, 417-428.e13 (2020).
45. L. Subissi, C. C. Posthuma, A. Collet, J. C. Zevenhoven-Dobbe, A. E. Gorbalenya, E. Decroly, E. J. Snijder, B. Canard, I. Imbert, One severe acute respiratory syndrome coronavirus protein complex integrates processive RNA polymerase and exonuclease activities. Proc. Natl. Acad. Sci. 111, E3900–E3909 (2014).
46. R. N. Kirchdoerfer, A. B. Ward, Structure of the SARS-CoV nsp12 polymerase bound to nsp7 and nsp8 co-factors. Nat. Commun. 10, 2342 (2019).
47. D. Kim, J.-Y. Lee, J.-S. Yang, J. W. Kim, V. N. Kim, H. Chang, The Architecture of SARS-CoV-2 Transcriptome. Cell. 181, 914–921 (2020).
48. B. Korber, W. M. Fischer, S. Gnanakaran, H. Yoon, J. Theiler, W. Abfalterer, N. Hengartner, E. E. Giorgi, T. Bhattacharya, B. Foley, K. M. Hastie, M. D. Parker, D. G. Partridge, C. M. Evans, T. M. Freeman, T. I. de Silva, C. McDanal, L. G. Perez, H. Tang, A. Moon-Walker, S. P. Whelan, C. C. LaBranche, E. O. Saphire, D. C. Montefiori, A. Angyal, R. L. Brown, L. Carrilero, L. R. Green, D. C. Groves, K. J. Johnson, A. J. Keeley, B. B. Lindsey, P. J. Parsons, M. Raza, S. Rowland-Jones, N. Smith, R. M. Tucker, D. Wang, M. D. Wyles, Tracking changes in SARS-CoV-2 Spike: evidence that D614G increases infectivity of the COVID-19 virus. Cell. 182, 812-827.e19 (2020).
49. A. R. Gruber, R. Lorenz, S. H. Bernhart, R. Neuböck, I. L. Hofacker, The Vienna RNA websuite. Nucleic Acids Res. 36, W70–W74 (2008).
50. D. Deng, K. Zhao, D. Hendrix, D. H. Mathews, L. Huang, LinearFold: Linear-Time Prediction of RNA Secondary Structures. Bioinformatics. 35, i295–i304 (2019).
51. D. Kozakov, D. Beglov, T. Bohnuud, S. E. Mottarella, B. Xia, D. R. Hall, S. Vajda, How good is automated protein docking? Proteins. 81, 2159–2166 (2013).
52. H. Zhou, X. Chen, T. Hu, J. Li, H. Song, Y. Liu, P. Wang, D. Liu, J. Yang, E. C. Holmes, A. C. Hughes, Y. Bi, W. Shi, A Novel Bat Coronavirus Closely Related to SARS-CoV-2 Contains Natural Insertions at the S1/S2 Cleavage Site of the Spike Protein. Curr. Biol. 30, 2196-2203.e3 (2020).
53. L. van Dorp, D. Richard, C. C. S. Tan, L. P. Shaw, M. Acman, F. Balloux, No evidence for increased transmissibility from recurrent mutations in SARS-CoV-2. Nat. Commun. 11, 5986 (2020).
54. R. Wölfel, V. M. Corman, W. Guggemos, M. Seilmaier, S. Zange, M. A. Müller, D. Niemeyer, T. C. Jones, P. Vollmar, C. Rothe, M. Hoelscher, T. Bleicker, S. Brünink, J. Schneider, R. Ehmann, K. Zwirglmaier, C. Drosten, C. Wendtner, Virological assessment of hospitalized patients with COVID-2019. Nature. 581, 465–469 (2020).
55. J. Kuipers, A. A. Batavia, K. P. Jablonski, F. Bayer, N. Borgsmüller, A. Dondi, M.-A. Dragan, P. Ferreira, K. Jahn, L. Lamberti, M. Pirkl, S. Posada-Céspedes, I. Topolsky, I. Nissen, N. Santacroce, E. Burcklen, T. Schär, V. Capece, C. Beckmann, O. Kobel, C. Noppen, M. Redondo, S. Nadeau, S. Seidel, N. Santamaria de Souza, C. Beisel, T. Stadler, N. Beerenwinkel, Within-patient genetic diversity of SARS-CoV-2. bioRxiv. (2020).
56. M. L. Ballesteros, C. M. Sánchez, L. Enjuanes, Two amino acid changes at the N-terminus of transmissible gastroenteritis coronavirus spike protein result in the loss of enteric tropism. Virology. 227, 378–388 (1997).
57. J. Yu, S. Qiao, R. Guo, X. Wang, Cryo-EM structures of HKU2 and SADS-CoV spike glycoproteins provide insights into coronavirus evolution. Nat. Commun. 11, 3070 (2020).
58. G. Studer, C. Rempfer, A. M. Waterhouse, R. Gumienny, J. Haas, T. Schwede, QMEANDisCo—distance constraints applied on model quality estimation. Bioinformatics. 36, 1765–1771 (2020).
59. A. Rambaut, N. Loman, O. Pybus, W. Barclay, J. Barrett, A. Carabelli, T. Connor, T. Peacock, D. L. Robertson, E. Volz, COVID-19 Genomics Consortium UK, Preliminary genomic chacterisation of an emergent SARS-CoV-2 lineage in the UK defined by a novel set of spike mutations. arambaut at virological.org (2020).
60. S. A. Kemp, R. P. Datir, D. A. Collier, I. Ferreira, A. Carabelli, W. Harvey, D. L. Robertson, R. K. Gupta, Recurrent emergence and transmission of a SARS-CoV-2 Spike deletion ΔH69/ΔV70. bioRxiv. (2020).
61. H. Tegally, E. Wilkinson, M. Giovanetti, A. Iranzadeh, V. Fonseca, J. Giandhari, D. Doolabh, S. Pillay, E. J. San, N. Msomi, K. Mlisana, A. von Gottberg, S. Walaza, M. Allam, A. Ismail, T. Mohale, A. J. Glass, S. Engelbrecht, G. Van Zyl, W. Preiser, F. Petruccione, A. Sigal, D. Hardie, G. Marais, M. Hsiao, S. Korsman, M.-A. Davies, L. Tyers, I. Mudau, D. York, C. Maslo, D. Goedhals, S. Abrahams, O. Laguda-Akingba, A. Alisoltani-Dehkordi, A. Godzik, C. K. Wibmer, B. T. Sewell, J. Lourenço, L. C. J. Alcantara, S. L. K. Pond, S. Weaver, D. Martin, R. J. Lessells, J. N. Bhiman, C. Williamson, T. de Oliveira, Emergence and rapid spread of a new severe acute respiratory syndrome-related coronavirus 2 (SARS-CoV-2) lineage with multiple spike mutations in South Africa. medRxiv. (2020).
62. T. N. Starr, A. J. Greaney, S. K. Hilton, D. Ellis, K. H. D. Crawford, A. S. Dingens, M. J. Navarro, J. E. Bowen, M. A. Tortorici, A. C. Walls, N. P. King, D. Veesler, J. D. Bloom, Deep Mutational Scanning of SARS-CoV-2 Receptor Binding Domain Reveals Constraints on Folding and ACE2 Binding. Cell. 182, 1295–1310.e20 (2020).
63. The Severe Covid-19 GWAS Group, Genomewide Association Study of Severe Covid-19 with Respiratory Failure. N. Engl. J. Med. 383, 1522–1534 (2020).
64. X. Chi, R. Yan, J. Zhang, G. Zhang, Y. Zhang, M. Hao, Z. Zhang, P. Fan, Y. Dong, Y. Yang, Z. Chen, Y. Guo, J. Zhang, Y. Li, X. Song, Y. Chen, L. Xia, L. Fu, L. Hou, J. Xu, C. Yu, J. Li, Q. Zhou, W. Chen, A neutralizing human antibody binds to the N-terminal domain of the Spike protein of SARS-CoV-2. Science. 369, 650-655 (2020).
65. global report investigating novel coronavirus haplotypes, P.1 report. SARS-CoV-2 lineages (2020).
66. J. Fantini, C. Di Scala, H. Chahinian, N. Yahi, Structural and molecular modelling studies reveal a new mechanism of action of chloroquine and hydroxychloroquine against SARS-CoV-2 infection. Int. J. Antimicrob. Agents. 55, 105960 (2020).
67. S. Suhail, J. Zajac, C. Fossum, H. Lowater, C. McCracken, N. Severson, B. Laatsch, A. Narkiewicz-Jodko, B. Johnson, J. Liebau, S. Bhattacharyya, S. Hati, Role of Oxidative Stress on SARS-CoV (SARS) and SARS-CoV-2 (COVID-19) Infection: A Review. Protein J. 39, 644–656 (2020).
68. C. Piller, Disgraced COVID-19 studies are still routinely cited. Science. 371, 331-332 (2020).
Submitted (version 1) April 5, 2020 / Online May 12, 2020

Projects p24/TMED Structural Modeling Critical Issues on Caveolin Critical Issues on Carbohydrates Hypertensive Crisis Previous Work


